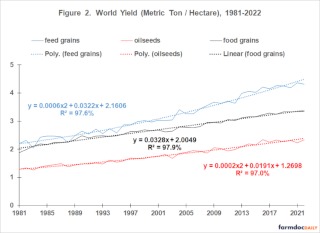
World Yield: Since 1980, world yield has a 2nd degree polynomial time trend for feed grains and oilseeds but a linear time trend for food grains (see Figure 2). Lowest explanatory power is 97% for oilseeds. Relative to a linear model, the 2nd degree polynomial is statistically higher with confidence of 99% for feed grains and 95% for oilseeds (see Data Note 3). For feed grains and oilseeds, trend yield measured in metric ton per hectare has increased each year with the increase becoming larger over time.
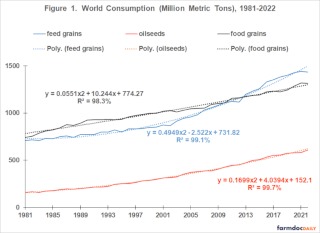
Yield Gap: Historical time path of trend yield derived from the equations in Figure 2 are presented in Figures 3, 4, and 5 for world feed grains, oilseeds, and food grains, respectively. Figures 3-5 also present the increase in yield needed to satisfy the trend increase in consumption derived using the equations in Figure 1 and assuming harvested area is the same as the preceding year (i.e. no increase in harvested area). Data Note 4 contains an example of this calculation.
In 2000, world feed grains transitioned from needing less harvested land to needing more harvested land to satisfy growing consumption (see Figure 3). The yield gap has increased since. For oilseeds, trend yield has always been less than the increase in yield needed to satisfy the growth in trend consumption (see Figure 4). More oilseed land has been needed, but the yield gap has not increased since the late 1990s. For food grains, the two yields have similar paths, but in 2002 food grains transitioned from needing slightly less land to needing slightly more land each year (see Figure 5).
World Harvest Area: The combined land harvested for feed grains, oilseeds, and food grains since 1980 underscores the story in Figures 3-5. Harvested land exhibited no trend before 2002, varying around an average of 835 million hectares. Since 2002, it has increased from 824 million hectares to a projected 986 million hectares for the 2022 crop year. The rate of increase has averaged 0.9% per year, which translates, using 2022 projected harvested land, into a need for nearly 9 million more hectares or 22 million more acres of feed grains, oilseeds, and food grains per year. This additional land is equivalent to adding the principal crop acres farmed in Illinois each year.
Source : illinois.edu