Innovation in climate services is happening at a high speed, therefore it is necessary to update studies on the use of these services in agriculture. The objectives of this study are to characterize the access to weather/climate information in Midwest agriculture, to identify farmers’ predisposition to adjust farm management decisions based on a seasonal climate forecast, and to identify opportunities to improve the provision of climate services for agriculture.
Qualitative and quantitative tools were combined in the analysis. First, interviews with open questions were conducted with 12 farmers in Illinois. Working with qualitative information allowed a better understanding of decision-making in agriculture and the demands for climate services. These interviews were transcribed and analyzed with an open coding system using Atlas ti software.
Then, an online survey was conducted through the list of subscribers to farmdoc in which 181 answers were obtained from farmers. The questionnaire included 5 sections: 1. Characteristics of the production system, scale and land tenure. 2. Main sources of risk in farming. 3. The access to climate information. 4 Influence of climate information on decisions. and 5. Farmers’ sociodemographic characteristics. [1] The interview did not ask about sources of risk, and instead included an open question about the demand for decision support tools based on climate information and forecasts.
Farmers and Farms Characteristics
Most of the farmers who participated in this study have their fields in Illinois. Some manage land in other states within the US Corn Belt. Corn and soybean crops predominate, in most cases in a 50%-50% rotation. The third crop of importance is wheat. Seventeen percent of the farms have livestock, but in most cases, this activity is of less importance in relation to crop production.

The 12 farmers interviewed manage between 80 and 6,070 acres, with a median of 790 acres. Farmers who answered the online survey manage somewhat smaller areas, from 8 to 3,850 acres with a median of 324. The area-weighted average percentage of rented land is 44% and 42% in the interviews and online survey, respectively.
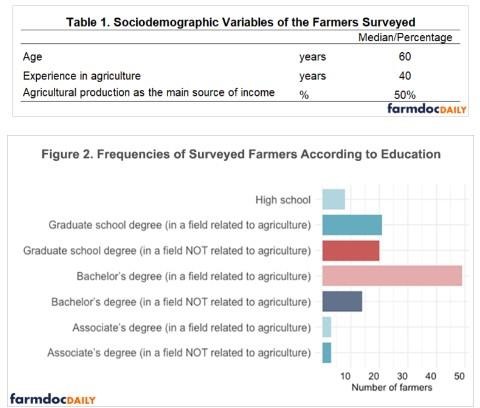
Table 1 and Figure 2 summarize the sociodemographic variables of the farmers surveyed (The farmers who participated in the interview have very similar sociodemographic characteristics to those who participated in the online survey).
Sources of Risk in Farming
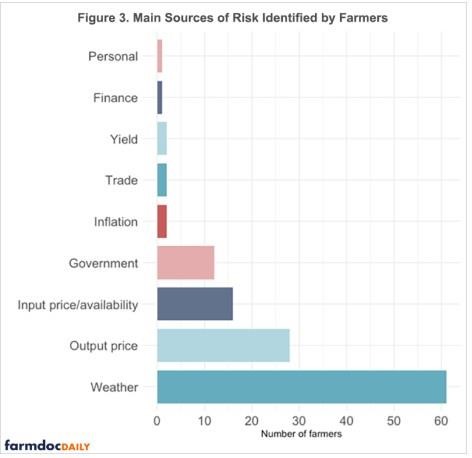
Figure 3 shows the frequency with which different sources of risk were mentioned as the most important. The question on sources of risk was open and the answers were classified into the categories that appear in the figure. The weather was identified as the main source of risk for most farmers, followed by output and input prices and government interventions in fourth place.
Drought and strong winds were the most frequent weather events with a highly negative effect on yields (Figure 4).
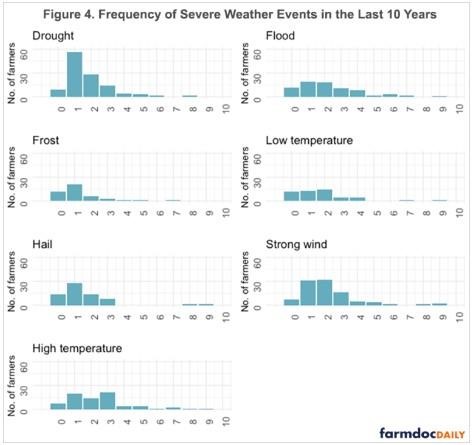
Note: The figure shows the answers to the question: “Considering the last 10 crop years, how many times did you face weather events with an extreme negative effect on the yield in any of your crops? (Consider an extreme effect a 40% or more decrease in yields, relative to average productivity)”
Sources of Weather/Climate Information
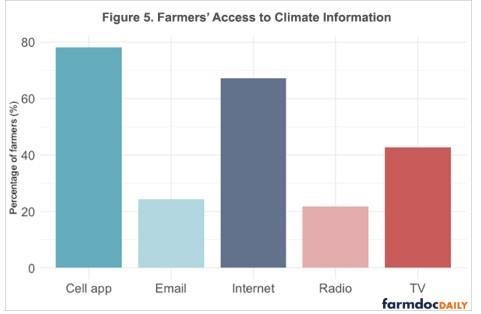
Most farmers (63%) check weather/climate information several times a day, 34% do it once a day, and the remaining 3% once a week. Farmers access information mainly through cell phone applications, they also consult this information on the internet, TV, email, and radio (Figure 5).
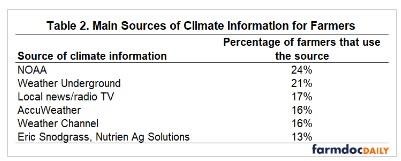
The three most popular sources of weather/climate information for farmers are the National Oceanic and Atmospheric Administration (NOAA), Weather Underground, and local news on TV and radio (Table 2). Farmers indicated that they access NOAA and Weather Underground information on websites and cellphone apps. The internet website and cell app, are the most frequent way of access, for NOAA and Weather Underground, respectively.
Within the weather/climate information for agriculture, different types can be identified: 1. historical data, 2. recent history, 3. immediate forecasts (6 hours), 4. short-term forecasts (5-7 days), 5. medium-term forecasts (15 days) and 6. seasonal or long-term forecasts (3 weeks-months). Some quotes from the farmers’ interviews provide some insight into the different kinds of information that are of farmers’ interest:
Historical data and recent history
“…they have the Palmer drought index maps;
“… if Argentina, Brazil, South America are struggling weather-wise…”
Recent history
“After a rain, I pulled it on my phone, and I can see exactly how much rain fell on a particular farm.”
Immediate forecast
“… in the radar, is the rain coming?”
Short- and medium-term forecast
“I’ll always be looking at the 10-day forecast…”
“… there is not only temperature and rainfall that we rely on, it is also wind…”
they have the temperature trend maps.”
“…they have a daily forecast, an update for North America, South America, Brazil, Argentina, Australia, China, and Russia.”
Seasonal forecasts
(About El Niño-La Niña): “I follow it, yes, it’s interesting”
Summary
Farmers identify the weather/climate as the main source of risk in their business. The most frequent way in which weather/climate information is accessed is in cell phone apps, and the most popular source of information is NOAA (National Oceanic and Atmospheric Administration). Different types of information are of interest to farmers, including historical data and short- and long-term forecasts, both for the US Midwest and for the other main production regions of the world.
A second report (part II) will address how farmers use weather/climate in farming decision making and the demand for climate services.
Source : illinois.edu