By Scott Irwin
Department of Agricultural and Consumer Economics
University of Illinois
The USDA Prospective Plantings report on March 31st indicated that U.S. farmers this year intended to plant 91.444 million acres of corn and 87.6 million acres of soybeans. These estimates sent shockwaves through the grain markets. There has been much discussion since the Prospective Plantings report was released about the potential for USDA acreage estimates to increase in subsequent reports. A farmdoc daily article last week (
April 14, 2021) showed that revisions of USDA planted acreage estimates are unbiased. In other words, based solely on the history of USDA acreage revisions, the best expectation of final USDA acreage estimates at the present time are those published in the March Prospective Plantings report. This does not mean USDA planted acreage estimates will not change in future reports, only that the direction and magnitude cannot be predicted without additional information. The purpose of this article is to analyze whether revisions to USDA corn and soybean planted acreage estimates can be predicted based on two important pieces of additional information: i) price movements after the release of the March Prospective Plantings report, and ii) planting progress.
Analysis
The first USDA planted acreage estimate for corn and soybeans in a crop year are provided in the March Prospective Plantings report. These estimates can and usually are revised in the June Acreage report. Planted acreage estimates can then be further revised in Crop Production reports released in August through November. Acreage revisions in Crop Production reports are usually very small except in October, when the USDA uses Farm Service Agency (FSA) acreage data to revise planted acreage estimates. Final planted (and harvested) acreage estimates are then made in the Crop Production Annual Summary report usually released in January after harvest. Further revisions can be made in the following crop year and after the Agricultural Census, which occurs every five years.
Similar to our work last week (farmdoc daily,
April 14, 2021), the analysis focuses on USDA planted acreage revisions between the March Prospective Plantings and the January Crop Production Annual Summary reports. The January estimate is usually considered the “final” for a crop year. Hence, the change in estimates between March and January is the most relevant measure of the total revision for a crop year to the market.
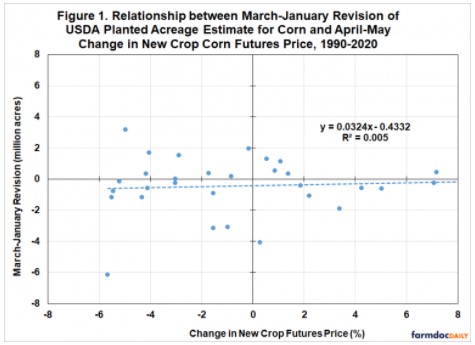
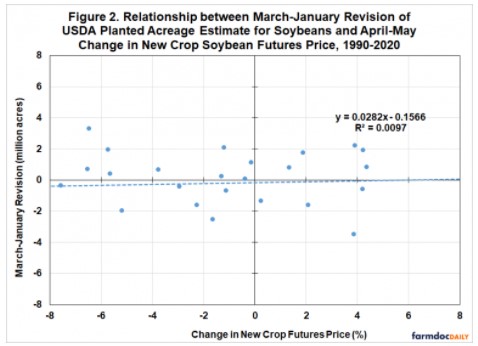
We begin by considering the relationship between USDA corn and soybean acreage revisions and price changes during the two-month period that immediately follows the release of the Prospective Plantings report. Specifically, we collect new crop futures prices for corn and soybeans on three dates: i) the business day immediately following the release of the Prospective Plantings report, ii) the last business day of April, and iii) the last business day of May. The day following the release of the Prospective Plantings report is used as the base for computing percentage price changes over the month of April and for the two-month April-May period. A monthly percentage price change for May is also computed. We argue that the April-May period brackets the period when the vast majority of adjustments in corn and soybean acreage decisions can be made in response to price changes.
Figures 1 and 2 show revisions to USDA planted acreage estimates for corn and soybeans, respectively, and new crop futures prices changes in April-May over 1990-2020. Based on the economic theory of supply, we would expect positive price changes for each crop to lead to larger acreage planted, all else equal. It turns out there is no evidence of a statistical relationship, with the R2 in both cases of essentially zero. New crop futures price changes over April-May have no ability to predict USDA corn and soybean acreage revisions. We also considered April and May price changes separately and found basically the same result.
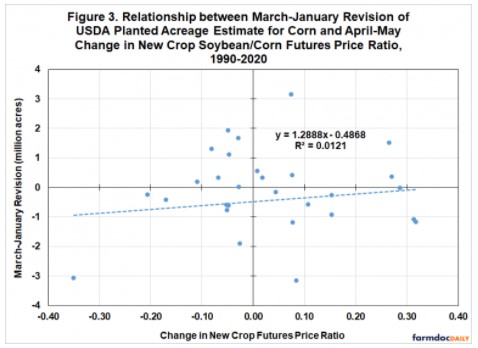
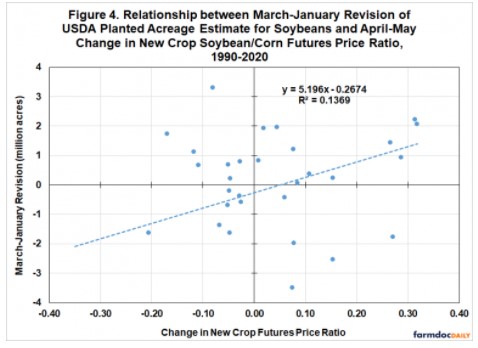
Rather than the change in the level of new crop futures prices, Figures 3 and 4 consider the change in the ratio of new crop soybean and corn futures prices over April-May. This measures the change in the incentive to plant soybeans relative to corn. For both corn and soybeans, the relationship of USDA acreage revisions and changes in the soybean/corn price ratio is positive. This is the first clue that changing to price ratios does not improve the ability to predict acreage revisions very much. One would expect the relationship to be negative for corn and positive for soybeans. Once again, the R2 for both crops is very low. While the estimated slope for soybeans is positive as expected, the fit is so poor that the relationship could not be used with any confidence to predict acreage revisions. Consider that a change in the ratio of 0.3 is associated with a soybean acreage revision anywhere from about -2 to +2 million acres.
The previous analysis suggests that new crop futures price changes are of little use in predicting USDA planted acreage revisions for corn and soybeans. However, this does not mean that other variables cannot be used to predict the revisions. With that in mind, we next consider corn and soybean planting progress as predictors. The argument is that given good weather and faster than normal planting progress, farmers will plant more corn and less soybeans. We measure the speed of planting progress as 100 minus late planting, with late planting defined in these earlier farmdoc daily articles (
May 13, 2020;
May 20, 2020). Since corn late planting is defined as acreage planted after May 20th, the corn planting progress variable is the amount of corn acreage planted before May 20th. Likewise, since soybean late planting is the amount of soybean acreage planted after May 25th, the soybean planting progress is the amount of soybean acreage planted before May 25th (before 2000 the cutoff date is May 30th). Average planting progress over 1990-2020 is then subtracted from each observation to express planting progress as the deviation from average.
Figure 5 shows the estimated relationship between corn acreage revisions and planting progress. There is indeed a positive and statistically significant relationship between corn planting progress and acreage revisions. The estimated slope coefficient of 0.0822 implies that 10 percent faster than normal planting progress leads to an 822,000 acre increase in the area planted to corn. A caution is that the R2 for this regression is still fairly modest at 29.5 percent, which means that a wide range of acreage revisions is possible for each level of corn planting progress. The explanatory power does rise to 48.6 percent if the 2020 observation is deleted. This is the observation far below the other data points in Figure 5. In 2020, most of the U.S. corn crop was planted in a timely manner and this explains the above average planting progress. However, planting was delayed considerably in the Dakotas and this led to substantial prevented planting acres in those states, which in turn helped to pull down the U.S. planted acreage estimate after March.
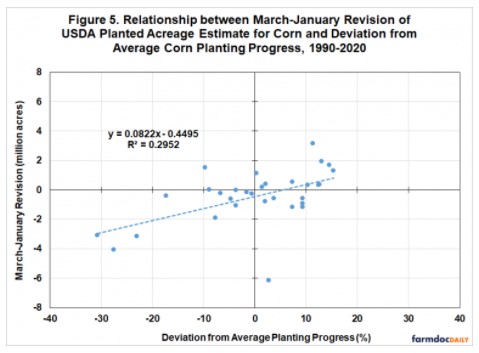
Figure 6 shows the estimated relationship between soybean acreage revisions and planting progress. Like corn, there is a positive relationship but the explanatory power in soybeans is so low that one would be hard pressed to actually use the relationship for prediction. We also checked whether corn planting progress was related to soybean acreage revisions. If corn acreage goes up due to rapid corn planting progress, it would be reasonable to expect that soybean acreage would go down given that corn and soybeans substitute in acreage for much of the U.S. However, this was not borne out in the data as the R2 of this alternative regression was once again near zero.
Implications
The recent USDA Prospective Plantings report indicated that U.S. farmers intended to plant 91.444 million acres of corn and 87.6 million acres of soybeans, both of which were substantially smaller than expected. This article analyzed the degree to which revisions to the USDA corn and soybean acreage estimates can be predicted by price changes following the Prospective Plantings report and planting progress. We find virtually no evidence that changes in new crop corn and soybean futures prices over April-May are useful for predicting USDA planted acreage revisions for the two crops. However, we do find that there is a positive and statistically significant relationship between corn planting progress and acreage revisions. Specifically, a 10 percent faster than normal planting progress leads to an 822,000 acre increase in the area planted to corn. Even though this relationship is statistically significant, the overall explanatory power of the regression is fairly modest, which means that a wide range of acreage revisions is possible for each level of corn planting progress. No useful evidence found of a relationship between soybean planting progress and soybean acreage revisions is found.
In sum, the only useful relationship uncovered here is between corn planting progress and corn acreage revisions. If springtime weather is good and corn planting progress is faster than normal, it is reasonable to expect corn planted acreage to increase compared to the March USDA estimate.