The next step of the analysis is to estimate the impact of late planting on the U.S. average corn yield. The first method we use is to directly estimate the relationship between the trend deviation for U.S. corn yield and U.S. corn acreage planted late over 1980 through 2019. The trend deviation is computed based on a linear trend for U.S. average corn yields over this period. Figure 3 shows that, as expected, there is an overall negative relationship between late planting and corn yield deviations from trend. Specifically, for a 10 percent increase in late planting the U.S. average corn yield decreases by 2 bushels per acre. Note that we assume a linear relationship in Figure 3, whereas we assumed a non-linear quadratic relationship previously (farmdoc daily, May 1, 2019). We changed here to a linear relationship based on the 2019 observation, which was well above a fitted quadratic line but close to the fitted linear line. It is also interesting to consider the implication of the intercept estimate of the regression model. It implies that when late planting is zero the increase in corn yield above trend is 3.5 bushels. This is the maximum benefit of early planting on the U.S. average yield of corn according to this regression model. In comparison, the maximum loss in yield from high levels of late planting can be much larger. For example, the model predicts that the level of late planting in 2019—50 percent—leads to a 6.3 bushel decline below trend for the U.S. average corn yield.
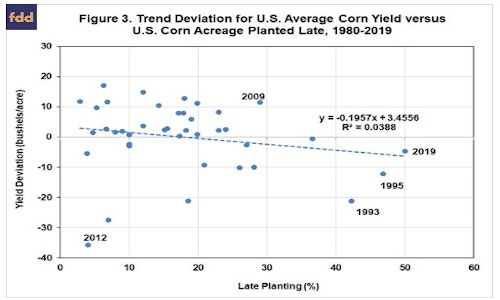
It is important to emphasize that the explanatory power of the regression model in Figure 3 is quite low, as the R2 is only 3.9 percent. Because of this low explanatory power, the regression model in Figure 3 should be treated with a good deal of caution. This does not mean that late planting should be ignored when projecting corn yield, but rather, other factors, in particular summer weather, are typically more important in explaining deviations from trend yield (e.g., Nielsen, 2015). Two years provide good examples. Late planting was well above average in 2009 but the corn yield was a record at the time due to a cool, wet summer. Conversely, late planting in 2012 was at the low end of the sample range but corn yield was extremely low relative to trend due to the severe drought that summer.
Since a number of factors influence the magnitude of the U.S. average corn yield in any given year, particularly summer weather conditions, it is necessary to estimate the impact of all relevant factors in order to quantify the impact of late planting. In technical terms, this means that the regression model in Figure 3 may suffer from “omitted variable bias.” We address this problem by estimating a crop weather regression model that relates the U.S. average corn yield to trend, the percentage of the crop planted late, and an array of weather variables. In brief, based on observations from 1980 through 2019, we specified a crop weather model of the U.S. average corn yield with a linear trend, late planting as shown in Figure 2, quadratic functions of preseason (September-March), April, June, July, and August precipitation, and linear functions of April, May, June, July, and August temperatures as explanatory variables. The weather variables are acreage weighted-averages for the Corn Belt. The model has a high explanatory power, with an R2 of 98.2 percent. The coefficient estimates indicate that the U.S. average corn yield is decreased by 2.2 bushels per acre for each 10 percent of the crop that is planted late. It is interesting to observe how close the late planting coefficient estimated for the crop weather model is to estimate from the simple bivariate model presented in Figure 3. For all practical purposes, they are nearly the same at about -0.2.
Our third and final method of estimating late planting impacts takes advantage of the variation in late planting across Corn Belt states during 2019. The idea is that the variation in late planting and yields across states in 2019 is large enough that it can be used to estimate late planting impacts. It is important that the states included in the analysis are large producing states so the resulting estimate is representative of late planting impacts nationally. With that as background, Figure 4 shows the deviation from corn trend yield in 2019 for 10 major Corn Belt states versus the deviation from average for late planting in each state. The trend yield for each state is estimated via a linear regression over 1980-2019. The deviation from average late planting over 1980-2019 is used instead of the level of late planting because the average level of late planting differs across states. Note also that state level late planting variables are used in this analysis not the national level variable used in the previous two methods.
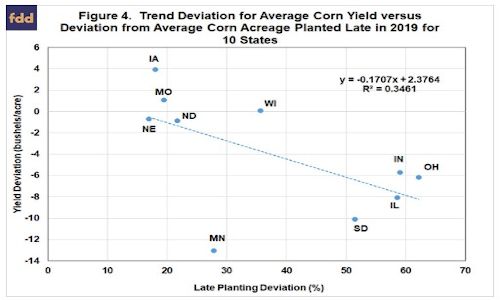
Figure 4 shows that despite the small number of cross-sectional observations, the resulting regression model has a surprisingly high R2 of 35 percent. The estimated coefficient on the late planting variable is -0.1707, which implies that a 10 percent increase in late planting decreases the state average corn yields by 1.7 bushels per acre. This is quite close to the estimates for the U.S. average corn yield generated by the first two methods.
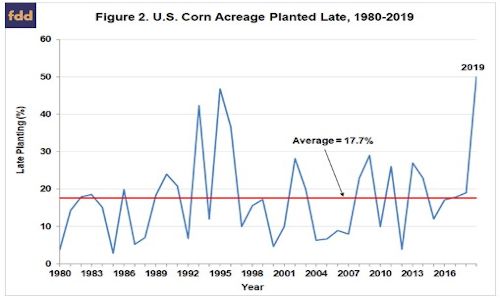
In sum, despite the differences in the three methods and data, the estimates of the impact of late planting on the U.S. average corn yield are quite similar, ranging between 1.7 to 2.2 bushels per acre for a 10 percent increase in late planting. A median estimate is therefore about 2 bushels per acre for a 10 percent increase in late planting. In terms of practical application, it is probably most straightforward to apply this estimate using the deviation from trend for yield and deviation from the average level of late planting. For example, assume a corn trend yield of 177 bushels per acre for the U.S. in 2020. Next, assume that the trend yield of 177 bushels incorporates the average level of late planting during the 1980-2019 sample period of 17.7 percent. Then, the trend yield can be adjusted upwards or downwards depending on the deviation of 2020 late planting from average. If late planting is 27.7 percent, or 10 percent above average, then trend yield should be reduced 2 bushels to 175 bushels per acre. Likewise, if late planting is 7.7 percent, or 10 percent below average, then trend yield should be increased 2 bushels to 179 bushels per acre.
Implications
The impact of late planting on projections of the U.S. average corn yield is always an important issue at this time of year. In this article, we estimate the impact of late planting on the U.S. average corn yield over 1980 through 2019 using three different approaches and compare the estimates for consistency. The three methods are: i) a bivariate model of U.S. corn trend yield deviations and the level of late planting, ii) a crop weather regression model that relates the U.S. average corn yield to trend, the percentage of the crop planted late, and an array of weather variables, and iii) a cross-sectional model of 2019 state corn yield trend deviations and deviations from average late planting. Despite the differences in the three methods and data, the estimates of the impact of late planting on the U.S. average corn yield are quite similar, ranging between 1.7 to 2.2 bushels per acre for a 10 percent increase in late planting. A median estimate is therefore about 2 bushels per acre for a 10 percent increase in late planting. At the present time, it appears that U.S. corn acreage planted late (after May 20th) will be average to below average. This could boost projections of the 2020 U.S. average corn yield by as much as 1 to 2 bushels per acre. Of course, the main show—summer weather—for determining corn yields is still on the horizon.
Source : illinois.edu