By Gary Schnitkey,
Department of Agricultural and Consumer Economics
From 2013 to 2018, U.S. soybean yields have been above trend in all years, with an average yield-above-trend of 3.7 bushels per acre. States have had different experiences with above trend yields. Six states had an average yield-above-trend of over 5.0 bushels per acre. Four states had average yield-above-trends of less than 2.0 bushels per acre. The geographical patterns of state yields are described in this article.
Above Trend Yields for the United States
In the December
Crop Production Report, the National Agricultural Statistical Service (NASS) reported the average U.S. soybean yield for 2018 as 52.1 bushels per acre. This 2018 yield is the highest, being just a bit higher than the 2016 yield of 52.0 bushels per acre.
Figure 1 shows U.S. soybean yields reported by NASS from 1980 to 2018. Also shown are trend yields. In this article, a trend yield is based on a linear regression using the 40 years of data previous to trend yield. The 1994 trend yield is based on the forty U.S. yields from 1954 to 1993. The 1995 yield is based on data from 1955 to 1994, the 1996 yield used data from 1956 to 1995, and so on. This procedure causes each trend year to be based on the same amount of data. Note further that trend yields are not declining in recent years. If anything, those trend yields are increasing.
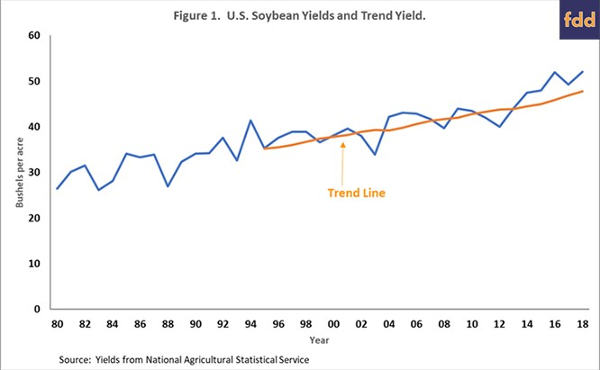
U.S. yields have been above trend yields since 2012, the drought year. This six-year run has been remarkable in its length. Moreover, yields have been well above trend in recent years. For example, the U.S. yield was 52 bushel per acre in 2016 while the trend yield was 45.9 bushels per acre. In 2016, the yield-above-trend was 6.1 bushels per acre, the largest value for all the years for which the value was computed. The second highest level above trend occurred in 2018 when the actual yields of 52.1 bushels per acre and yield-above-trend was 4.4 bushels per acre. The next highest value occurred in 2005 when the actual yield was 3.3 bushels per acre above trend. The 3.3 yield-above-trend in 2005 is 1.1 bushels less than the 2018 value.
Geographical Variations
From 2013 to 2018, U.S. yields averaged 3.7 bushels per acre above trend. To see if there was geographical variability in yield-above-trends, a similar analysis was conducted for each state for which sufficient yield data exists. For each state, trend yields were calculated for each year from 2013 to 2018. Then the difference between actual yields and trends were calculated for each year. Finally, the average differences from 2013 to 2018 were then calculated.
As can be seen in Figure 2, there is geographical variability to the yield-above-trends. Six states had average yield-above-trends over 6 bushels per acre. All of these states bordered the Mississippi River and included Louisiana (8.2 bushels per acre), Mississippi (7.5), Kentucky (6.9), Tennessee (6.7), and Illinois (6.5).
There were also a number of states that had yield-above-trends less than 2.0 bushels per acre. These states included Michigan (2.0), Pennsylvania (1.8), Wisconsin (1.5) and North Dakota (0.3).
There are tendencies to the above geographical distribution. Southern states typically have higher yields, extreme northern state have lower yields, and states in the middle have more mixed resulted. However, those tendencies do not hold for all states. For example, Texas in the south has a yield-above-trend average of 2.9 bushels per acre, considerably below the other southern states. Similarly, South Dakota in the north has a yield-above-trend of 6.0 bushels per acre, considerably above many of the other northern states.
An interesting comparison is the I-states in the heart of the Corn Belt. Illinois with a 6.5 yield-above-trend is significantly above the U.S. average of 3.7 bushels per acre. Indiana has a 3.8 yield-above-trend, near the U.S. average. And Iowa has a 2.5 yield-above-trend which is below the national average. States relatively close to one another in the heart of the Corn Belt had different yield experiences.
Commentary
A combination of good growing conditions, continuing increases in genetic potential of soybean varieties, and changes in farming practices likely contribute to high yields (farmdoc daily, December 29, 2017). Southern states appear to have adopted farming practices that continue to lead to improved soybean yields. In Illinois, soybean management systems have changed with a move to earlier planting and use of seed treatments and fungicides.
Still, geographic patterns do raise questions. Why has Illinois’ experience of high yields differ from that of Indiana and Iowa? South Dakota’s exceptional yields stand in contrast to states surrounding South Dakota. Why did South Dakota have better yields than states around South Dakota?
These questions likely will not be answered with complete clarity. Further examinations of farming practices and weather in states with higher and lower yield-above-trends may shed light on those questions. Of course, weather events and soybean pests could change those patterns in future years.