Panel A of Table 1 contains the WAOB crop weather model forecasts for May-August over 2013-2019, along with the NASS August forecast and the USDA final yield estimate each year. We include NASS yield forecasts for August, as these are considered the “gold-standard” when projecting corn yields. In addition, we report the WAOB model forecasts for May-July 2020. We could not compute the August 2020 WAOB model forecast because we do not yet have access to the June and July weather data for 2020. The early season WAOB model forecasts start at 158 bushels per acre in May 2013 and increase to 178.5 bushels per acre in May 2020. The 20.5 bushel increase in forecasts over this period represents an average increase in yield forecasts of 2.6 bushels per year. Note that in most years the published WAOB yield forecast is the same during May-July, which makes sense when planting progress comes in near the historical average and the June precipitation shortfall is zero.
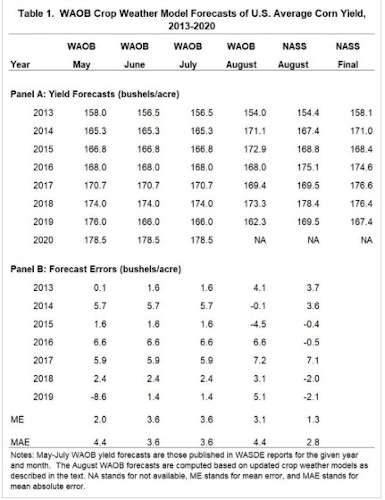
Panel B of Table 1 contains the WAOB yield forecast errors for May-August over 2013-2019. The errors are computed by subtracting the forecasts found in Panel A from the final USDA estimates, also found in Panel A. Of course, 2020 errors cannot be computed because final yield is not yet available. The accuracy record of the WAOB model is mixed, with some May forecasts near the final estimate (2013 and 2015) and some relatively far from the final estimate (2016 and 2019). This is not unexpected for early season forecasts, as key weather information is not yet available. It is interesting to observe that all but one of the forecast errors in May-July are positive, which implies that the WAOB model under-estimated the final corn yield. The mean errors (ME) presented at the bottom of Table 1 indicate that the average level of under-estimation (bias) ranged from 2.0 bushels in May to 3.6 bushels in June and July. NASS yield forecasts in August also under-estimated on average over 2013-2019, but at 1.3 bushels this was the smallest bias of the forecasts considered in Table 1.
A key measure of forecast accuracy is mean absolute error (MAE), which is simply the average of the absolute value of the forecast errors presented in Panel B of Table 1. This is a measure of how close the forecast comes to the final USDA estimate, irrespective of whether the forecast is too high or too low. The MAE for the WAOB crop weather forecasts over 2013-2019 ranged between 3.6 and 4.4 bushels per acre. In percentage terms, this represents 2.1 to 2.6 percent of the forecast levels reported in Panel A of Table 1, which strikes one as reasonably accurate considering the simplicity of the WAOB crop weather model. Furthermore, this represents an improvement in percentage accuracy compared to the 1993-2014 period, as reported in this earlier farmdoc daily article (April 30, 2015). One should treat this comparison with some caution, however, because of the two very large forecast errors that occurred in 1993 and 2012 due to the historically unusual weather conditions in these two years (floods in 1993 and drought in 2012). Finally, the NASS August yield forecast has the smallest MAE (2.8 bushels) of the forecasts found in Table 1. This is not surprising because NASS forecasts are based on thousands of farm operator and objective yield samples, and one would expect forecasts based on such extensive information to be more accurate.
The next step of the analysis is to generate corn yield forecasts using the alternative crop weather model presented in this farmdoc daily article (June 25, 2020). We are interested whether this alternative crop weather model is more or less accurate than the WAOB model. This crop weather model relates the U.S. average corn yield to a linear trend, late planting, quadratic functions of June and July precipitation, and a linear function of July temperature as explanatory variables. The weather variables are acreage weighted-averages for 10 states in the Corn Belt.
We use the following procedure to generate corn yield forecasts for this alternative crop weather model:
- Estimate the crop weather model coefficients using data from 1988-2012.
- Compute May-August 2013 forecasts by plugging in known variables at the time of the forecast is assumed to be made, and projecting values for the remaining variables. The trend variable is always the index value of the forecast year. When projections are necessary for linear variables (planting progress, July temperature), sample averages over 1988-2012 are used. When projections are necessary for non-linear variables (June and July precipitation), a Monte Carlo simulation is used in order to reflect the quadratic impact on yield forecasts. August forecasts are based on actual values for all variables.
- Repeat the process by adding one year to the estimation sample period and computing May-August forecasts for the following year.
Panel A of Table 2 contains the alternative crop weather model (IH) forecasts for May-August over 2013-20202, along with the NASS August forecast and the USDA final yield estimate each year. We could not compute the July and August 2020 model forecasts because we do not yet have access to the June and July weather data for 2020. The early season IH model forecasts start at 160.9 bushels per acre in May 2013 and increase to 177.3 bushels per acre in May 2020. The 20.5 bushel increase in forecasts over this period represents an average increase in yield forecasts of 2.1 bushels per year. Note that that IH model forecasts differ across months because different combinations of variables are known vs. projected each month.
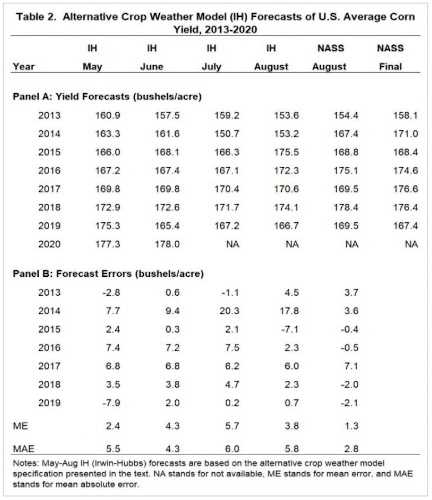
Panel B of Table 2 contains the alternative IH yield forecast errors for May-August over 2013-2019. Once again, the errors are computed by subtracting the forecasts found in Panel A from the final USDA estimates, also found in Panel A. Like the WAOB model, the vast majority of the forecast errors in May-August are positive, which implies that the IH model under-estimated the final corn yield. The mean errors (ME) presented at the bottom of Table 2 indicate that the average level of under-estimation (bias) ranged from 2.4 bushels in May to a whopping 5.7 bushels in July. The high level of bias in July and August forecasts can be directly traced to huge under-estimates of final yield made in 2014. It is interesting to note that the WAOB model did not make nearly as large of an under-estimate in 2014. The reason is the WAOB model is not as sensitive to July precipitation. This was an advantage in 2014 when the very unusual combination of low July precipitation and a new record yield occurred. The mean absolute error of the alternative IH crop weather model ranged from 4.3 to 6.0 bushels per acre. In percentage terms, this represents 2.6 to 3.8 percent of the forecast levels reported in Panel A of Table 2, which is higher than the comparable figures for the WAOB crop weather model.
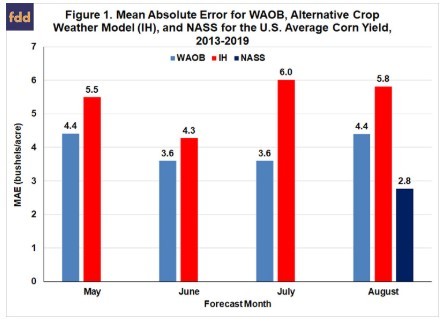
Figure 1 presents the month-by-month mean absolute errors for the WAOB crop weather model, the IH alternative crop weather model, and the NASS forecast in August. Two results stand out. First, the WAOB crop weather model is more accurate in all four months, and by a considerable amount in May, July, and August. Second, the NASS forecast in August is substantially more accurate than either of the crop weather model forecasts. The NASS forecast beats the WAOB model forecasts in August by 1.6 bushels and the IH alternative model by 3.0 bushels. The NASS forecasts are the clear victors in terms of August forecast accuracy.
Implications
Crop weather models are widely used to make early season corn yield forecasts. We examine the accuracy of forecasts from two crop weather models over 2013-2019 in this article. The first is the model developed and maintained by the World Agricultural Outlook Board (WAOB) of the USDA. It is used to generate forecasts for the May, June, and July WASDE reports. The second is an alternative but similar crop weather model that we developed and presented in an earlier farmdoc daily article (June 25, 2020). We find that nearly all of the early season forecasts from the models during this eight-year period were too low, with the bias ranging from about 2 to 6 bushels per acre. In terms of mean absolute forecast error, the WAOB crop weather model was more accurate than our crop weather model in all four months. Consequently, in horse-race terms, the WAOB model is hands down the winner over our alternative model. Finally, the NASS forecast in August is the clear victor in terms of accuracy compared to either crop weather model. It is no wonder then that the August Crop Production report is so highly anticipated.
Source : illinois.edu