Statewide Evaluation Of Foliar Fungicides On Soybeans In 2022

Feb 20, 2023

Foliar fungicides were evaluated across seven Iowa State University research and demonstration farms to determine their performance for disease and yield response on soybean in 2022. These farms included the Northwest Research and Demonstration Farm (Sutherland), Northern Research and Demonstration Farm(Kanawha), Northeast Research and Demonstration Farm (Nashua), Central Iowa Research Farms (Ames), Armstrong Memorial Research and Demonstration Farm (Lewis), McNay Memorial Research and Demonstration Farm (Chariton), and Southeast Research and Demonstration Farm (Crawfordsville).

A total of 17 fungicides containing single and multiple active ingredients were evaluated at each location. Fungicide treatments were laid out in randomized complete block design with four replications. Plot size ranged from 25.5 to 40 ft long and 10 to 15 ft wide (4-6 rows on 30-inch inter-row spacing). Soybean cultivar NK 28-T3XF was planted at all locations. Corn was planted in previous year in all the locations except Nashua where oats was the previous crop. Planting dates across the locations and other field activity details are provided in Table 1. All fungicides were sprayed using a self-propelled research sprayer at recommended rates at the beginning of pod (R3 growth stage) with nonionic surfactant (Induce at 16 oz per 100 gallons water). Foliar diseases were assessed when soybeans reached the R6 (full seed) growth stage. Septoria brown spot (caused by Septoria glycines) progression was assessed by measuring the height of the highest infected leaf in the canopy, and the disease severity was estimated as the percent of leaf area covered by the disease on the highest infected leaves. A total of two assessments, one in each row (a couple plants per row), were collected and averaged for a plot. Other foliar fungal diseases were also assessed, including frogeye leaf spot (caused by Cercospora sojina) and Cercospora leaf blight (caused by Cercospora species) if present in 10 leaves in the upper canopy of each plot. Total seed weight/plot and moisture were measured with a 2009 Almaco SPC20 research plot combine. Seed weight was adjusted to 13 percent moisture and yield was calculated in bushels per acre.

Result summary

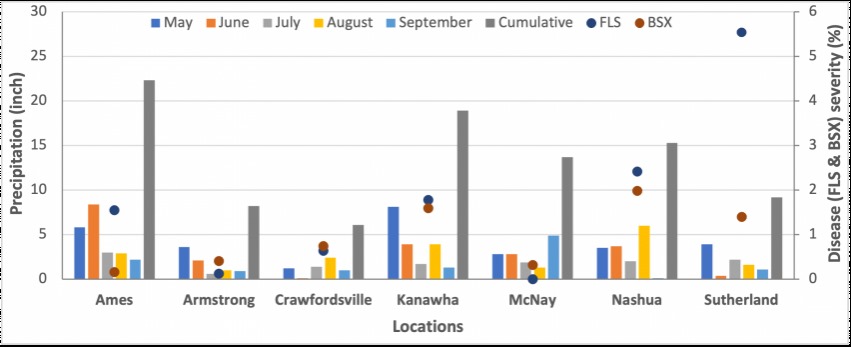
In 2022, the precipitation pattern during the season was different across the locations, Ames, Kanawah and Nashua received greater cumulative precipitation (May to September) (>15 inch) than the other locations (Figure 1). However, the total precipitation and precipitation occurred in August, the critical month for foliar disease development, was fairly low in most of the locations. Frogeye leaf spot and Septoria brown spot were the two diseases observed most frequently but both occurred at very low levels in all locations. Where frogeye leaf spot did show up, its development started extremely late in the growing season (end of August). Fungicide effect was not statistically significant at all locations for Septoria brown spot and 5 locations for frogeye leaf spot, perhaps because of the very low level of disease. There was significant effect of fungicides on severity of frogeye leaf spot in Ames and Nashua. Across the seven locations, Miravis Neo, Lucento, Delaro Complete, Regev HBX, Quadris Top, Veltyma, Revytek and Acropolis significantly reduced (34-71%) frogeye leaf spot severity as compared to untreated control (UTC). Delaro Complete, Veltyma and Lucento were the most effect fungicides (65-71% reduction of frogeye leaf spot). No other foliar diseases were observed at significant level in any locations.

As compared to untreated control (UTC), yield was significantly greater for Miravis Neo at McNay and in Domark 230, Lucento, Quadris Top and Veltyma at Sutherland. However, overall yield response to fungicide across the seven locations was not statistically significant (Figure 1). In 2022, overall soybean yield was similar to 2021 but greater than 2020 (Mueller et al. 2021, 2020). Check plots, when all the locations were combined, yielded 64.6 bu/A. Overall, no fungicides produced statistically greater yield than check although yield in some fungicide treatment was numerically greater.

Management recommendations

Soybean fungicides can provide yield benefits when there are foliar diseases. Some reports show yield benefit of fungicides at low levels of disease or when disease was absent but this is not consistent. Cercospora sojina and Septoria glycines strains resistant to QoI fungicides were confirmed throughout Iowa a few years ago. Judicious use of fungicides and an integrated method of disease management that does not depend only on fungicides, should be used to manage the diseases and preserve the efficacy of existing fungicides. Disease management practices such as crop rotation, planting disease-resistant cultivars, and application of fungicides with multiple modes of action can all be used slow selecting for fungicide resistance.

Table 1. Research location, seed rate, planting date, fungicide application date, disease assessment date, and harvest date for seven soybean fungicide trials throughout Iowa in 2022


IMG


Table 2. Fungicide products and their application rate for soybean fungicide trials conducted in seven Iowa State research and demonstration farms throughout Iowa in 2022
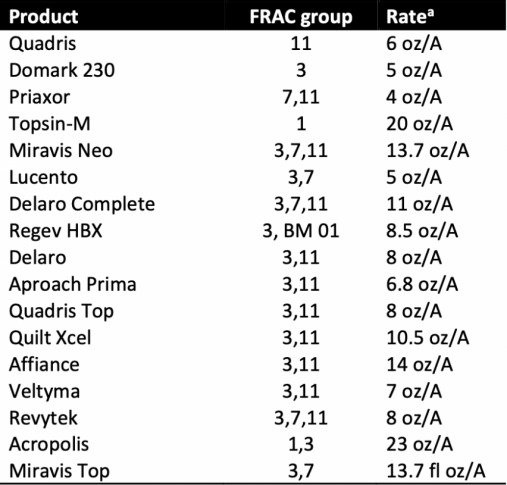
 

Table 2. Fungicide products and their application rate for soybean fungicide trials conducted in seven Iowa State research and demonstration farms throughout Iowa in 2022


 All products were applied at R3 stage with nonionic surfactant (Induce at 0.3% v/v)
IMG

Figure 1. Monthly and cumulative precipitation from May to September and average severity (%) of frogeye leaf spot (FLS) and Septoria brown spot (BSX) at untreated-control plots across the seven research locations in Iowa in 2022.
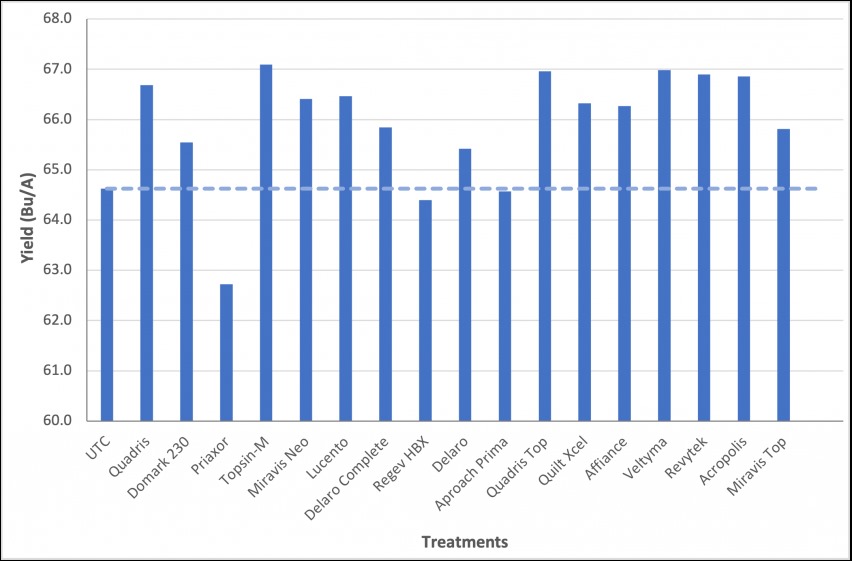
 

Figure 2. Soybean yield after application of fungicide products combined across all seven experiment locations in 2022. All fungicide products were applied at recommended rate at the beginning of pod (R3) with nonionic surfactant (Induce at 0.3% v/v). The treatments were not statistically different (P = 0.13).
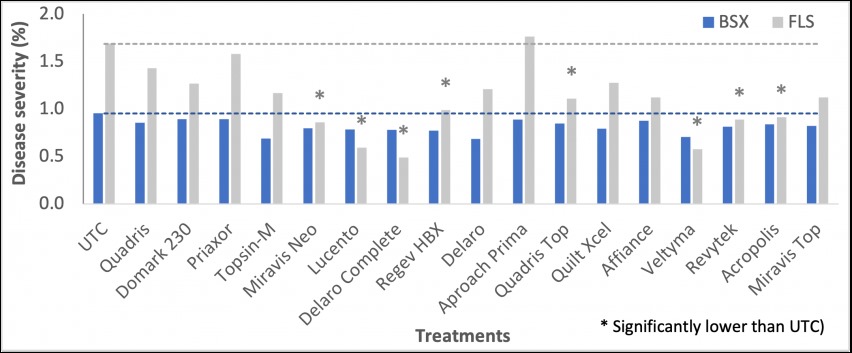
Figure 2. Soybean yield after application of fungicide products combined across all seven experiment locations in 2022. All fungicide products were applied at recommended rate at the beginning of pod (R3) with nonionic surfactant (Induce at 0.3% v/v). The treatments were not statistically different (P = 0.13).


Figure 3. Disease severity of Septoria brown spot (BSX) and frogeye leaf spot (FLS) after application of fungicide products combined across all seven experiment locations in 2022. All fungicide products were applied at recommended rate at the beginning of pod (R3) with nonionic surfactant (Induce at 0.3% v/v). The treatments were not statistically different (P = 0.12 for BSX and P < 0.001 for FLS).


Source : iastate.edu