By Vijaya Joshi, Jeff Coulter
Site-specific yield estimation is important for efficient management of agricultural inputs and explaining spatial yield variability. Current approaches for site-specific yield estimation include the use of historical yield maps (Fig. 1), crop simulation modeling, and remote sensing. Several years of historical yield maps provide information on spatial yield variability and help locate higher and lower yield zones in fields. However, the causes of yield variability may differ due to interactions among weather, crop management, and site characteristics such as soil type and topography.
Figure 1. Corn yield map from 2016 (above) and legend (right).
Crop models incorporate the effects of cultivar, soil, weather, and agronomic management, and simulate dynamic processes of crop growth, development, and yield. This approach is useful in providing information on yield-limiting factors. However, most crop models assume a uniform unit for application and their point-based simulation restricts their utility at larger spatial scales. At such scales, major limitations arise from the lack of site-specific inputs for model calibration and evaluation.
Remote sensing data from aerial and satellite imagery provide nearly real-time information on crop growth status at larger spatial scales. It has an advantage of rapid, site-specific estimation of crop parameters such as biomass and plant nitrogen (N) content. While the estimated crop parameters can distinguish the spatial yield variability in a field, they have limited application in determining the yield-limiting factors. The use of geospatial data on crop growth parameters from remote sensing with crop models offers an opportunity to improve site-specific estimation of crop yield and determine the most yield-limiting factors.
Crop modeling study
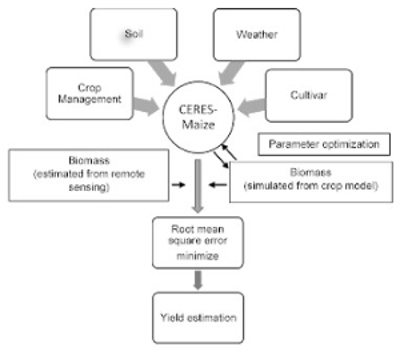
A study was conducted during 2016 and 2017 at the University of Minnesota Southwest Research and Outreach Center at Lamberton, MN to evaluate a crop modeling approach (CERES-Maize) and an integrated approach of crop modeling with remote sensing (RapidEye satellite imagery) to estimate site-specific corn yield response to fertilizer N. The experiment was carried out across a heterogeneous 17-acre field with and without N fertilizer treatments. The fertilized treatment received sidedress application of urea ammonium nitrate at the six leaf-collar stage (V6) according to university N rate guidelines. Corn biomass at the five (V5) and ten (V10) leaf-collar stages was estimated across the field using regression equations obtained between normalized difference vegetative index (NDVI) and field measured biomass data. The estimated biomass at V5 and V10 stages from satellite imagery were used to spatially optimize the total soil N concentration in the crop model (Fig. 2).

Figure 2. Diagram showing the use of remote sensing data with crop modeling for parameter optimization.
Results
Spatial optimization of total soil N concentration in the crop model improved yield simulations at both the V5 and V10 stages. However, optimization at V10 gave better yield simulations as compared to V5. These findings demonstrate that an integrated approach of crop modeling combined with remote sensing data could provide better simulations of the crop-soil system and improved corn yield estimates as compared to crop modeling alone. This approach could be useful for site-specific estimation of corn yield as well as for the development of spatially variable N fertilizer rate prescriptions.