This article reviews the latest US corn and soybean production and use forecasts from USDA which include forecasts for the new-crop 2023/24 marketing year. These new-crop supply and demand projections are valuable not because they necessarily enable users of the information to better predict forthcoming price changes, but because they establish expectations about future market conditions and provide context for forthcoming marketing decisions. Broadly speaking, prospects have coalesced around an inverted market structure with new-crop corn and soybean prices much lower than old-crop values. USDA projections for 2023/24 supply and demand support a return to prices near long-run average levels (See: farmdoc daily May 31, 2022), especially for corn. As planting ends and the growing season begins in earnest throughout the US Corn Belt, future price changes will be based on deviations from these expectations.
Corn Production and Use
On Friday, May 12, the US Department of Agriculture released its latest World Agricultural Supply and Demand Estimates (WASDE). The May WASDE report included USDA’s first complete projections for new-crop 2023/24 corn and soybean production and use. This does not imply that nothing is known or anticipated about new-crop market fundamentals prior to the May report; USDA does produce a limited new-crop commodity market outlook in February at its Annual Outlook Forum. More generally, market analysts have been forming price expectations for some time; for instance, futures contracts for delivery during the 2023 harvest time were listed for trade back in late 2019.
The new-crop WASDE production forecasts reflect updated acreage estimates released in the March Prospective Plantings report from the National Agricultural Statistics Service and yield estimates based on long-run trends. Thus, it is more instructive to view the May report as an important update to a widely followed benchmark supply and demand forecast.
Table 1 shows the old-crop and new-crop US corn balance sheets for corn from USDA. Old-crop use projections declined as US dropped its corn export forecast an additional 75 million bushels. This continues a series of declining 2022/23 corn export forecasts going back to the summer of 2022 (See: farmdoc daily March 13, 2023). Given fixed old-crop supply, the entire decrease in corn use is reflected in higher projected ending stocks, pushing the old-crop stocks-to-use ratio above 10%.
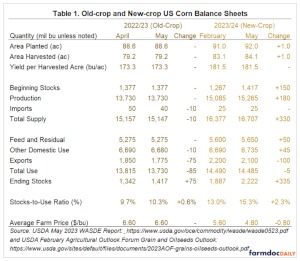
For new-crop corn, higher old-crop ending stocks combined with increased acreage to raise total projected supply by 330 million bushels to 16.7 billion bushels. If realized, US corn production and yield would set new records in 2023. New-crop use projections are all together basically unchanged from earlier forecasts released in February, but the composition of corn use is expected to shift toward domestic use and away from exports. Total use for 2023/24 is expected to be 755 million bushels greater than in 2022/23 with about half the increase coming from higher exports and half from greater feed use. Given diminished prospects for old-crop exports, the May new-crop export forecast of 2.1 billion bushels appears to be somewhat optimistic.
The net impact of USDA’s projections for supply and use are carry out stocks of 2.2 billion bushels and a stocks-to-use ratio of over 15%. Both numbers are burdensome for price expectations; accordingly, USDA lowered its 2023/24 average farm price forecast by 80 cents per bushel to $4.80/bushel. This is roughly in alignment with new-crop December 2023 futures prices which closed slightly lower on Friday, May 12 at $5.09/bushel.
Forming Corn Yield Expectations
The idea that it would take a record corn yield of 181.5 bushels per acre to meet current USDA supply projections is a possible source for more bullish corn price expectations than are apparent from the May USDA numbers. Some might question whether it is realistic to expect record yields, higher production, and much lower prices. To evaluate this assertion, Figure 1 plots US corn yield history and a 35-year trend line which forecasts corn yield in 2023 of 181.6 bushels per acre. This trend line is based on the same period (1988-2022) as used by USDA to generate its 181.5 bushels per acre forecast found in the new-crop balance sheet in Figure 1. However, it does not condition its projection on weather or other data. The procedure used by USDA to generate its expected yield projections is discussed in the farmdoc daily June 25, 2020 article.
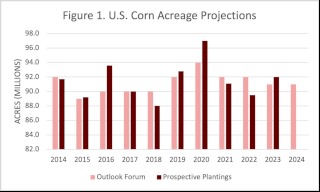
Figure 1 also shows US national average corn yields have been below trend for the past four years. This may lead to additional skepticism regarding record corn yield forecasts above 180 bushels per acre in 2023. However, Figure 1 shows the consistent long-run regularity of rising corn yields over time. There are few such regularities in grain markets and it seems foolish to disregard this one in hopes of higher new-crop prices. Other counterpoints to disbelief regarding USDA’s corn yield projection are years such as 1994, 2004, 2009, and 2014 where national average corn yield jumped well above trend.
Soybean Production and Use
USDA made smaller changes in the May WASDE report to its soybean balance sheets shown in Table 2. The old-crop balance sheet was essentially the same as the previous month. A small change in imports (which comprise less that 0.5% of US supply) led to a similar sized increase in ending stocks. Old-crop stocks remain tight with the stocks-to-use ratio still below 5%.
New-crop production forecasts were unchanged from earlier estimates provided at the February Agricultural Outlook Forum. USDA did adjust its soybean use estimates lower for both domestic crushing and exports. However, the net impact on projected ending stocks was relatively small with ending stocks increasing just 45 million bushels to 335 million bushels. The US stocks-to-use of 7.6%, up 1.1 percentage points from February’s USDA outlook and 2.7 percentage points from the projected old-crop value does not appear to be as bearish. However, the soybean market illustrated its greater dependence on global market conditions relative to corn. USDA projected global ending-stocks-to-use to increase from 27.7% in 2022/23 to 31.7% in 2023/24. This comparatively dramatic easing in world soybean availability led new-crop November 2023 futures price to fall 24 cents bushel to $12.24/bushel at the close of trade on Friday May 12.
Conclusion
USDA’s May WASDE report corroborated a bearish outlook for corn and soybean price levels in 2023/24 compared to levels observed in the past two years. The idea that new-crop corn and soybean prices will be closer to long-run levels is not news. The futures markets term structure, that is the prices for deliver at different dates, provides a higher frequency signal of relative commodity scarcity in the new-crop marketing year, at least compared to old-crop values. Old-crop/new-crop futures price spreads have been inverted for some time with old-crop prices significantly higher than new-crop values. Figure 2 shows that prices for July 2023 delivery have been much higher than harvest 2023 prices going back to summer of 2022. If anything, this old-crop/new-crop inverse is growing, particularly in the July-November soybean spread which neared +1.80 in April and is doing so again in May.
The production and use projections provided in the May WASDE report do more than just confirm what was already known from the term structure of forward prices. They level set expectations for important supply and demand indicators like crop yield and exports against which future news will be compared. Without forward-looking expectations for both prices and quantities, it is difficult to place news in context and understand its implications for commodity marketing. At this time, both balance sheet projections for production and use quantities and relative price expectations signaled by futures spreads indicate a return to longer-run price levels for corn and soybeans in 2023/24.
Source : illinois.edu