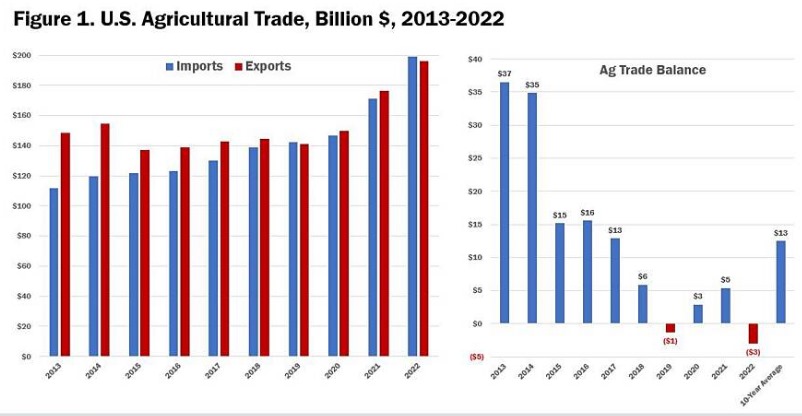
Exports by Product
Despite these rosy high-level numbers, 2022 trade data deserves deeper digging to uncover the interesting story lines sitting below the glossy surface. The first significant narrative is the sharp contrast between changes in export value versus changes in export volume. As noted above, export value across all products increased by 11% year-over-year, but export volume actually declined by 6%. Despite substantial increases in value across almost all categories, many categories of agricultural exports declined in volume in 2022. In Figure 2, we see that of the 14 included product categories, eight declined in export volume, while six increased. Starting on the positive side, cotton had the largest increase in volume – a whopping 16% - led by a 68% increase to China, U.S. cotton’s largest market in 2022. Soybeans also experienced an 8% increase in export volume, though the increase was attributable to a larger group of trading partners. U.S. soybean sales by volume were up by 11% to China, 21% to Mexico, 12% to Egypt, 17% to Japan, 37% to Germany and 30% to Taiwan – and those are just the 1-million-metric-tons-or-higher markets. Several livestock and livestock-related exports increased by volume. Poultry meat and products (excluding eggs) increased by 2.5%, beef and beef products increased by 2.8% and dairy products increased by 5.6%. Rounding out the six products with increased export volume, tree nuts increased 2.8%.
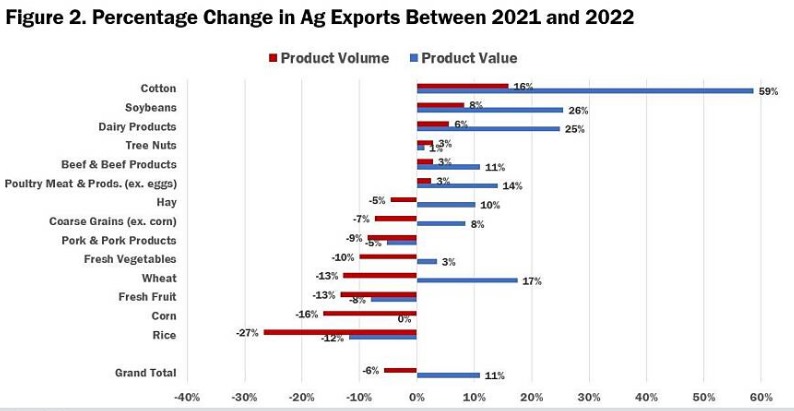
The next category is exports that increased by value while volume declined. Hay, coarse grains (sorghum, barley, oats and rye), fresh vegetables and wheat all belong in this category. For all four products, the spread between the decline in exports by volume and the increase in exports by value is significant. Hay exports by volume declined by 5%, while exports by value increased by 10%. This was a result of U.S. drought conditions limiting production and pushing up prices. Coarse grains decreased in volume by 7%, while exports by value increased by 8%. Again, drought conditions that limited production for many coarse grains in the 2022/23 marketing year were the likely culprit. (For example sorghum production was down 50% relative to the five-year average.) Fresh vegetables declined in volume by 10%, while export value was up 3%. Fresh vegetables encompass a large number of crops, which makes it harder to summarize the root causes, but there were large declines in export volume for both potatoes and sweet potatoes, while export value was up significantly for lettuce. The largest spread for the category is wheat, for which export volume declined by 13% and export value increased by 17%. This 30 percentage point spread was brought to you by the tight and volatile global market for wheat brought on by the uncertainty in Baltic Sea exports.
Finally, four of the included product categories declined in both export volume and export value. Those included pork and pork products, fresh fruit, corn and rice. Pork trade was particularly challenged by declining exports to China and Japan, its second- and third-largest markets by volume, respectively. Export volume to China was down 26%, while value was down 20%. Export volume to Japan was down 10%, while value was down 13%. Similar to the fresh vegetable category, the fresh fruit category encompasses a large number of crops, making summarization of the primary culprit for decline more difficult, though exports by both value and volume were down to the top five markets. Corn exports by volume were down 16%, while exports by value were only down 0.11%. Low Mississippi River levels during peak export season were a significant constraint for corn in 2022. Finally, rice exports by both value and volume had a terrible year in 2022. Export volume was down 27%, while export value was down 12%. Globally, rice prices did not experience the same increase in price as most commodities in 2022. On top of that, rice producers in the U.S. were subject to high input costs, making them a higher-cost producer relative to other global sources.
Export Markets
In 2022, U.S. exports remained concentrated in the top six markets. Sixty-seven percent of U.S. ag exports were to China ($38.2 billion), Mexico ($28.5 billion), Canada ($28.3 billion), Japan ($14.6 billion), EU-27 ($12.3 billion) and South Korea ($9.5 billion). As shown in Figure 3, exports by value to all six of these markets increased in 2022 relative to 2021, though a very strong dollar and elevated ocean freight rates took a toll, particularly, in Japan and South Korea, where exports by value only increased by 3% and 2%, respectively. It is worth noting the long trend of growth in U.S. agricultural exports to developing countries (12%), which outpaced export growth to developed countries (9%).
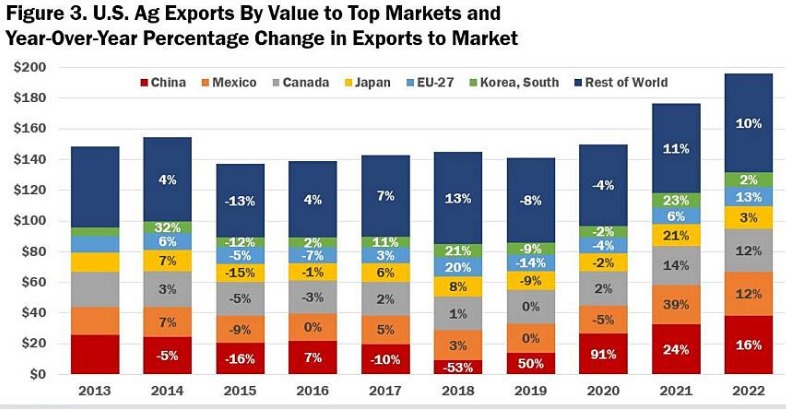
In 2022, China topped the list as the major market with the largest year-over-year increase in U.S. ag exports by value at 16%. Last year U.S. agricultural exports to China were nearly $10 billion higher than the next largest market, Mexico. Despite this significant growth, U.S. market share in the Chinese market remained relatively stagnant in 2022 at 18.8%. It was 18.5% in 2022. Meanwhile China’s ag exports from all destinations topped $216.9 billion in 2022, an increase of 5.5%, or $11.4 billion, from 2021. It is worth pointing out that Brazil’s market share increased to 24.2% in 2022, up from 22.1% in 2021.
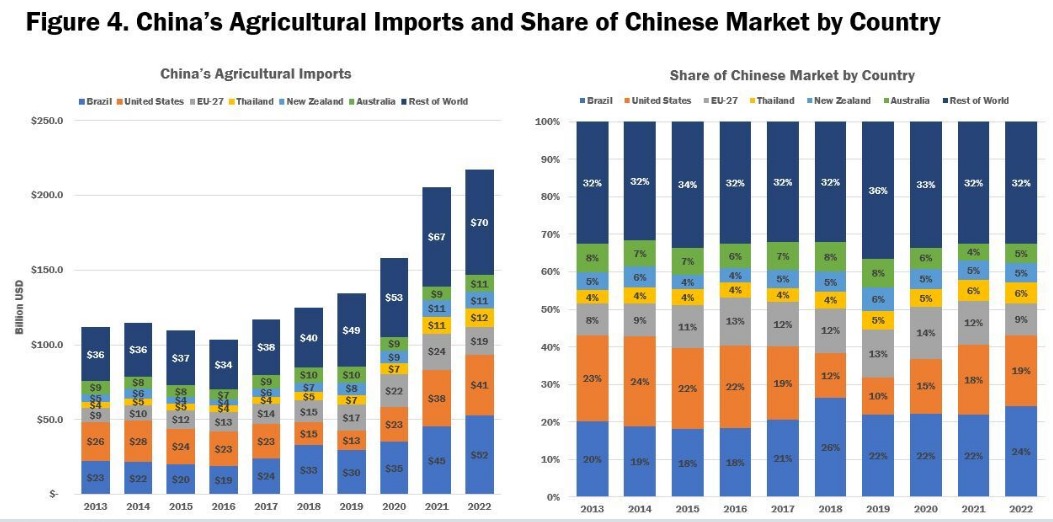
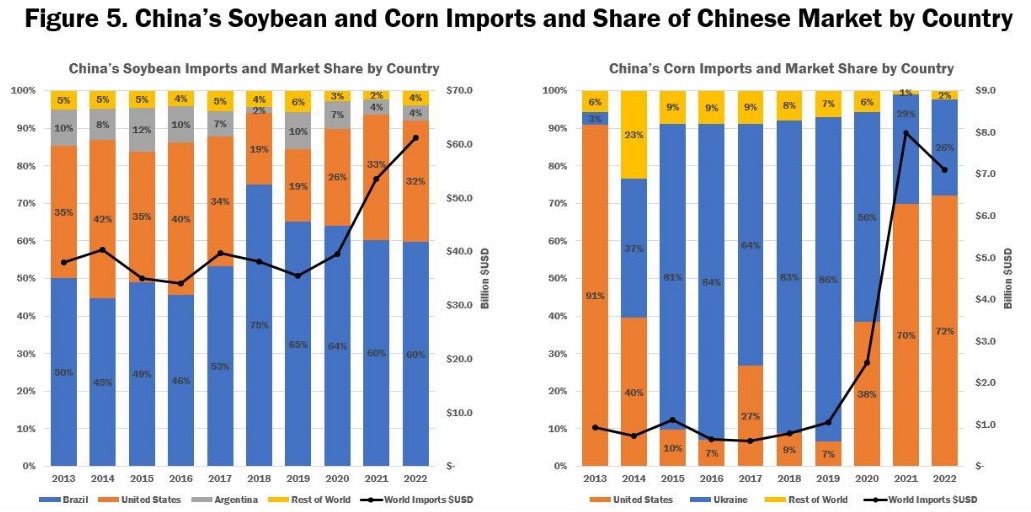
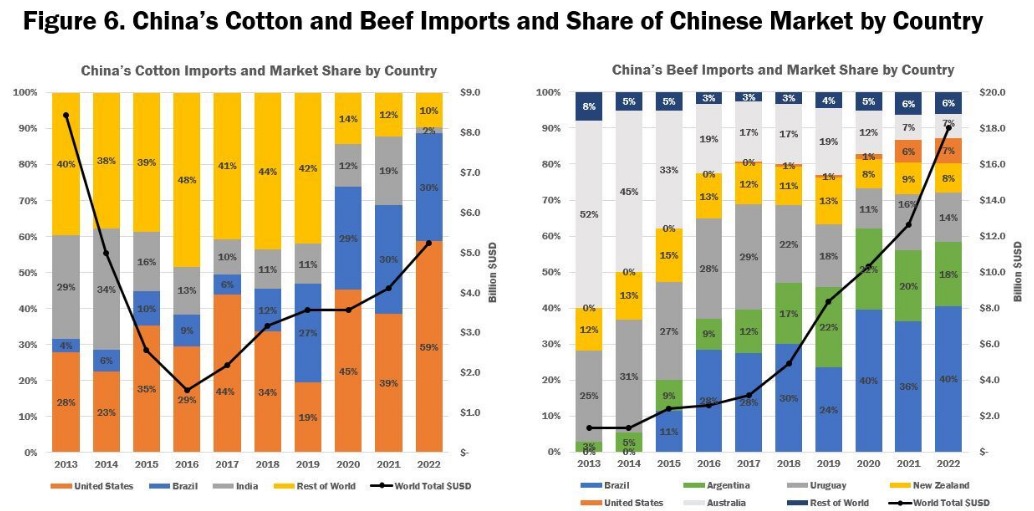
A deeper dive into the top four U.S. product exports to China (soybeans, corn, cotton and beef and beef products) reveals U.S. market share for each product remained largely constant in 2022 relative to 2021, with the exception of cotton. In 2022, the U.S. had 32% of China’s $61.2 billion soybean market compared to 33% of its $53.6 billion 2021 market. In 2022, the U.S. had 72% of China’s $7.1 billion corn market, compared to 70% of its $8.0 billion 2021 market. The U.S. captured a significantly larger share of China’s larger 2022 cotton market. In 2022, the U.S. had 59% of the $5.2 billion market, compared to 39% of its $4.1 billion 2021 market. Finally, rounding out the top four: in 2022, the U.S. had 7% of China’s $18 billion market for beef and beef products, compared to 6% of its $12.6 billion market. Overall, with some notable exceptions, U.S. improvements to market share in the Chinese market remained relatively flat, despite an overall growing market.
Click here to see more...