Figure 2. Typical distribution of fertilizer calibration pans that are spread across the width of the spreader to catch calibration samples. The fertilizer spreader is operated at typical field application speed and rates to determine the distribution of material across the width of a spinner spreader. (Image courtesy of The Ohio State University FABE-561)
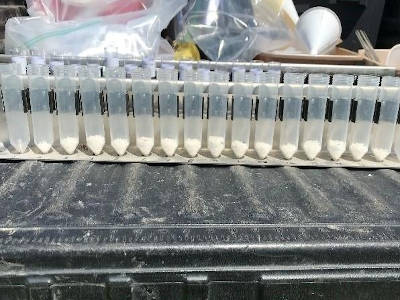
Figure 3. The small amount of product on each end of the pattern is expected since this is from a dual spinner machine, which relies on some pass-to-pass overlap to ensure a full rate is applied at the edges of the spread width. Notice the vial in the center appears to have more product than the surrounding vials. Overapplying in the center of the machine is a common issue with poorly adjusted spinner and air boom type machines. Information on correcting spread pattern problems can be found in this article (FABE-562) from The Ohio State University.
Spinner spreader distribution patterns often shift based on product density and application rate. It is typical to see distribution patterns that create a “W” pattern behind the spreader when application rates increase (Figure 4). Maintaining a consistent pattern across the width of the machine under all application rates is critical to eliminate local nutrient deficiencies. This is particularly important when applying nitrogen fertilizer due to increased crop responsiveness to reduced application rates.
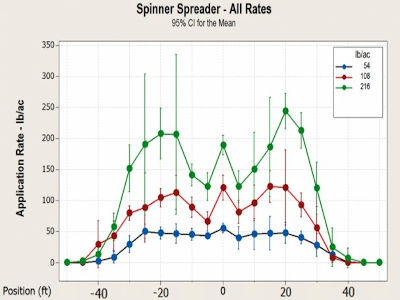
Figure 4. Example application pattern from a spinner spreader under three different application rates when spreading dry Urea. The application pattern shifts towards a W pattern as the application rate increases.
Many spreaders can do a high-quality job of applying fertilizer; however, the fertilizer applicator is responsible for making the appropriate adjustments to optimize the machine for a specific product and rate.
Understanding the machine’s application distribution allows the applicator to adjust the machine as environmental conditions change. For instance, as wind speed and direction changes, it is crucial to evaluate how this affects distribution and to make needed adjustments. This may include changing the driving direction or adjusting spinner speed to narrow the application width to mitigate any negative impacts.
Monitor product quality
One of the biggest causes of change in spreader distribution throughout the year is variability in product quality. It’s important to monitor density and hardness of the fertilizer granules as these can change due to storage conditions and environmental effects. Changes to density or hardness can have a direct impact on how fast the spinners can rotate without damaging the fertilizer granules, which affects how far the product can be spread.
To better visualize the effect product density has on spread distance and distribution, picture a golf ball and a ping pong ball. Both are similar in overall size, but the golf ball is heavier than the ping pong ball. The golf ball will travel farther because of the weight difference when thrown.
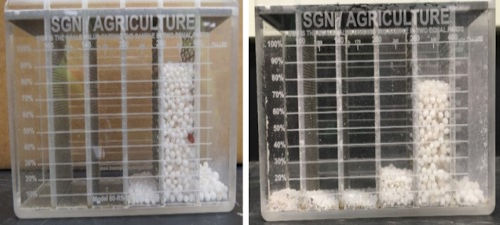
Product size is measured using a size grade number (SGN) scale (Figure 5) and hardness with a crush strength tester. Both tools are available through an equipment dealer or supporting vendor. These tools should be used to evaluate the product calibrated and to determine if the product quality changes during the season. If the product quality does change, the spreader should be recalibrated.
Source : iastate.edu