Farrow-to-Finish Enterprise
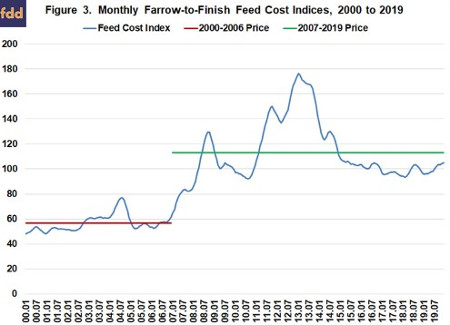
Figure 3 presents monthly farrow-to-finish feed cost indices from January 2000 to December 2019. The latest full year of indices, 2019, has an index of 100 so all indices outside of this year are expressed in relative terms. As with corn and soybean meal prices, a distinction is made for feed cost indices before and after 2007. The average index from 2000 to 2006 was approximately 57 while the average index since the beginning of 2007 was approximately 113. The index for January 2020 was 103.8, so current feed costs are 3.8 percent above the average for 2019. Projected monthly indices range from 100 to 102 for the rest of 2020.
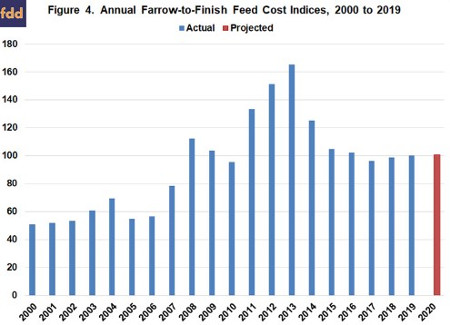
Annual farrow-to-finish feed cost indices are presented in Figure 4. The projection for 2020 (red bar) used corn and soybean meal futures prices in early February. The projected feed cost index for 2020 is 101.
Swine Finishing Enterprise
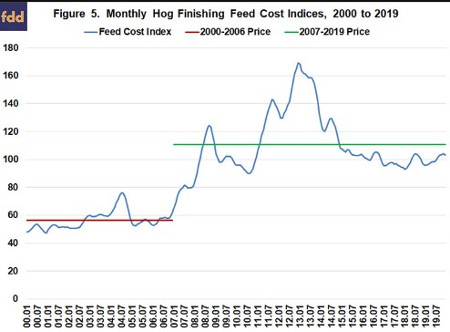
Figure 5 illustrates monthly swine finishing feed cost indices for the January 2000 to December 2019 period. The latest full year of indices, 2019, has an index of 100 so all indices outside of this year are expressed in relative terms. The average index for the 2000 to 2006 period was 56 while the average index for the period beginning in 2007 was 111. The index for January 2020 was 101.4, so current feed costs are 1.4 percent above the average for 2019. Projected monthly indices range from 99 to 101 for the rest of 2020.
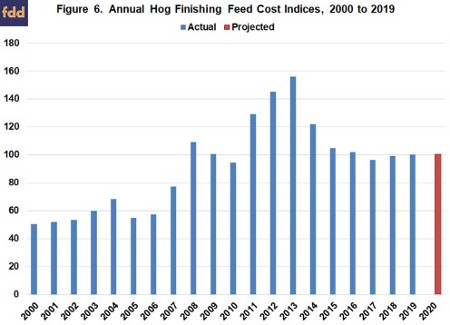
Annual swine finishing feed cost indices are presented in Figure 6. The projection for 2020 (red bar) used corn and soybean meal futures prices in early February. The projected feed cost index is 100. Thus, swine finishing feed costs for 2020 are expected to be very similar to those experienced in 2019.
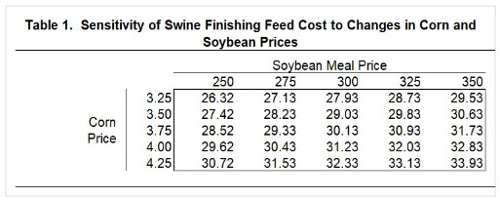
Using the iFarm price distribution tool (here), the probability of the corn futures price for December 2020 being below (above) $3.43 ($4.30) was 25 percent on February 4. This represents a spread of almost $0.90 per bushel. Feed costs are very sensitive to changes in corn and soybean meal prices. Regression analysis was used to examine the relationship between swine finishing feed cost, and corn and soybean meal prices during the January 2007 to December 2019 time period. Results are as follows: each 0.10 increase in corn prices increases feed cost per cwt. by $0.44, and each $10 increase in soybean meal prices increases feed cost per cwt. by $0.32. Obviously, a $0.40 increase or decrease in corn price would have a large impact on feed cost per cwt.
Current feed cost is approximately $32.25 per cwt. Table 1 presents feed cost per cwt. for corn prices ranging from $3.25 to $4.25 per bushel, and soybean meal prices ranging from $250 to $350 per ton. At the lower range of prices, feed cost per cwt. would be approximately $26.25. At the higher range of prices, feed cost per cwt. would be approximately $34.00.
Conclusions
This article discussed recent trends in feed costs for farrow-to-finish and swine finishing enterprises, and provided projections for 2020. Feed costs are expected to be similar to that experienced in 2019. However, current projections have a wide band around them. Current projections use corn prices, depending on the month, ranging from $3.60 to $4.00. Corn prices will be determined by planted acreage as well as other supply and demand factors. Thus, corn prices could be as low as $3.20 to as high as $4.10. This article examined the impact of changes in corn and soybean meal prices on swine finishing feed cost. Each $0.10 per bushel change in corn price, changes feed cost by $0.44 per cwt. Similarly, each $10 per ton change in soybean meal price, changes feed cost by $0.32 per cwt.
Source : Farmdocdaily