In 1956, Congress created the Soil Bank which removed acres from production completely through two policies. The acreage reserve program reduced acres (orange bars in Figure 1) below the allotment in a single crop year and placed the acres under conservation cover. The conservation reserve reduced acres (light green bars in Figure 1) further and placed them under conservation cover for multiple years (up to 10). The Soil Bank was effectively terminated by 1960 (farmdoc daily, February 20, 2020).
The shift from the Soil Bank to the Emergency Feed Grains program in 1961 effectively replaced the acreage reserve with an initial version of the set aside concept; emergency policy to try and reduce an overwhelming surplus of feed grains in federal storage (farmdoc daily, February 27, 2020). The 1961 program involved Payment-in-Kind (PIK) policy that provided a farmer with certificates on bushels in federal storage in return for reducing planted acres of the crop; acres reduced went into conservation cover rather than other crops. The Agricultural Act of 1970 was the next iteration of this policy, formally creating set aside acres as a requirement for eligibility for price support or other program assistance. This was the Nixon Administration’s recommended policy revision adopted by Congress. Unlike allotment acres, the acres set aside had to be diverted to conservation cover and could not be planted to a cash crop. Unlike the Soil Bank and PIK programs, there were no payments or other direct assistance on the set aside acres but, rather, the farmer had to comply with an annual set aside requirement in order to be eligible for commodity assistance. In 1972, farmers set aside 61.5 million acres from production but after the Soviet wheat deal, a commodity price spike and the push to expand production, set aside acres were used sparingly until the farm economic crisis began to worsen in 1978 (see e.g., farmdoc daily, May 30, 2019). Acres set aside through various programs are represented by the red bars in Figure 1.
The Reagan Administration re-created the PIK policy in 1983. The 1983 crop year remains the high-water mark for set aside policy when farmers reduced planting by nearly 78 million acres. That year farmers drastically reduced acres planted to corn by more than 20 million acres compared to the average planted acres in the five previous years; 60 million acres planted to corn in 1983 compared to nearly 83 million average acres planted to corn (1978-1982). As the economic crisis worsened, Congress created the modern Conservation Reserve Program (CRP) in the Food Security Act of 1985. CRP grew to nearly 25 million acres in 1988 and 30 million in 1989 (green bars, Figure 1). When combined with set aside, nearly 78 million acres were taken out of production in 1988, approaching the level from 1983. From that peak, set aside acres rapidly declined as the farm economy recovered in the 1990s. Authority to USDA to set aside acres from production was effectively eliminated with the change to decoupled program payments in the Federal Agricultural Improvement and Reform Act of 1996. Nearly 20 million acres had been set aside in 1995. Since 1996, CRP has been the only policy in place to remove acres from production and it does so under contracts covering ten to fifteen years with annual rental payments. CRP acres peaked in 2007 at nearly 37 million acres but have declined steadily since; 22 million acres were under contract in 2019.
USDA’s Economic Research Service publishes data for total cropland used for crops for all years since 1910. Total cropland used for crops includes the total of acres harvested for crops (and double-cropped), acres of crop failure and cultivated summer fallow (USDA ERS Major Land Uses). Figure 2 illustrates the total cropland used for crops as reported by ERS. Figure 2 provides critical perspective on this discussion. American agriculture is not currently experiencing excess or expanded acreage, at least by historic standards and especially as compared to the 1970s or the years prior to 1956. The years 1961 through 1972 are highlighted as the years that correspond to early set aside policies and the reduced acreage era between World War II and expansion in the 1970s.
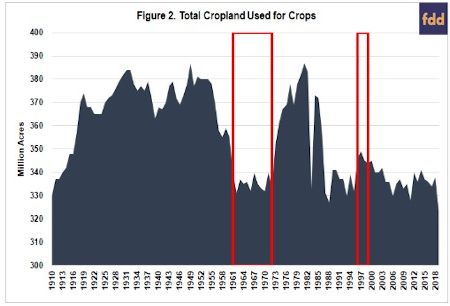
The data in Figure 2 generally aligns with the total acres planted to the major commodities discussed in an earlier article (farmdoc daily, April 9, 2020). One takeaway from Figure 2 is that initiating a set aside policy now would differ from earlier eras. Today any set aside policy would be applied to a much lower level of acres as compared to the late 1950s and the early 1980s; both eras when set aside policy reduced acres from an arguably excess situation. For example, total acres of cropland used for crops peaked at 387 million acres in 1981. By comparison, the average of these acres from 2007 to 2019 has been 335 million acres.
The second area highlighted in Figure 2 covers the years 1996 to 1999, the first few years after decoupling payments in the 1996 farm bill. Notably, total cropland used for crops since decoupling in the 1996 Farm Bill peaked in 1997 at 349 million acres and has not returned to that level since. Congress decoupled payments in 1996 as a major reform to farm policy after 63 years, with a goal to avoid having federal payments distort planting decisions on the farm. It was considered a market-oriented response that would permit farmers to make planting decisions based on signals from the marketplace (e.g., prices). In the years since, Congress has also drastically revised the crop insurance program in 2000 and returned to price-based assistance programs in 2002.
Figure 3 illustrates the total acres planted nationally to the major commodities as reported by USDA’s NASS Quick Stats database. Key eras are highlighted in Figure 3, the first corresponding to the early era of set aside acres as in Figure 2 (1961 to 1972). This era corresponds to reduced acreage in corn, but also covers a significant part of the steep decline in acres planted to the other feed grains (barley, oats, rye and sorghum). Planted acres around the heavy acreage reductions under the Reagan era PIK program in 1983 are also highlighted. The final two highlighted areas correspond to decoupling in 1996 and the initial years after that change in policy, as well as the initial years of the Renewable Fuels Standard (RFS) policy initiated by Congress in 2005 and increased in 2007.
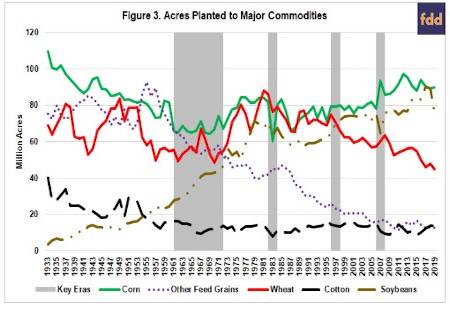
Figure 3 also emphasizes the acreage shifts since decoupling in 1996 as acres planted to soybeans exceeded acres planted to wheat. Onset of the RFS also appears to have contributed to a further decline in wheat acres. Since 2007, total acres planted to these commodities has averaged nearly 250 million acres; of those acres, corn and soybeans have averaged 170 million acres (68%). One takeaway is that any set aside acreage policy implemented in the near future is likely to be concentrated on planted acres for corn and soybeans.
Figure 4 provides the final historical perspective in this discussion that also serves as a starting point for further analysis in future articles by illustrating total national production of corn and the national average corn yield from 1933 to 2019. It highlights one of the biggest challenges for efforts to control production through reducing or setting aside acres. Specifically, corn yields have experienced significant increases, outside of weather problems such as drought in 2012, and that trend for yields is helping to drive increased production. Increasing trends for yields would require larger acreage reductions to achieve supply reductions, a problem experienced throughout the history of production control and set aside policies.
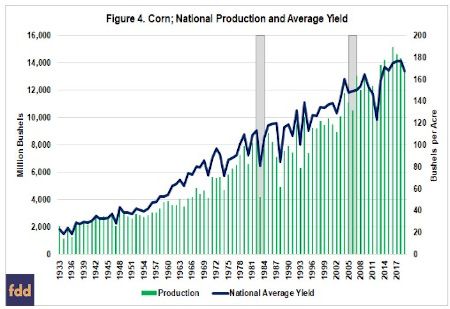
The onset of the RFS (2005 to 2007) is highlighted in Figure 4 because the years since it was created correspond with both increased acres planted to corn and increased yields to produce record levels of corn production (compare to Figure 3). Finally, the year 1983 is also highlighted because it corresponds to the PIK program’s drastic reduction in acres planted to corn. Total production in 1983 was about half of the average production in the five years prior (7.6 billion, 1978 to 1982) and the five years after (7.4 billion, 1984 to 1988). It was a year of drastic reductions in planted acres and a yield well below trend. A future article will take a deeper dive into 1983 to provide further perspective on this issue.
Conclusion
History demonstrates that difficult economic times in farming can drive demand for policies that seek to reduce or control supplies. Policies seeking to reduce acres and control supplies have been a consistent response to tough times. Acreage allotments were created in the Great Depression, the Soil Bank was created during a time of extraordinary surplus after World War II and the Korean War, in the midst of the technological revolution; set aside acres, PIK and CRP were all used in response to the economic crisis of the 1980s. The general goal through has been an effort to reduce acres in hope of helping to improve crop prices and farm income. A return to troubled times is currently revitalizing interest in set aside acreage policies and that interest is likely to grow if the challenges continue as expected for the foreseeable future. This article briefly reviews the history for set aside and acreage reduction policies to provide a starting point for further analysis. The goal of the discussion is to glean lessons from the past in order to apply them in the increasingly difficult discussions unfolding across the country.
Source : illinois.edu