Excessive rainfall in early to mid-April delayed corn plantings, and then unfavorable growing conditions led to a larger than average percentage of the corn and soybean crops in poor to very poor conditions. Recent Market Intel articles, Corn Planting is Stalled in the Midwest and Crops Currently in Poor Condition, But We Still Have Time, reviewed the economic implications of these planting and growing conditions.
These adverse growing conditions are likely to have a negative impact on crop yields in some areas. For example, USDA's weather-adjusted trend yield model reveals that for each percentage of the U.S. corn crop planted after mid-May yields drop by 0.289 bushels per acre. The yield response is not linear, however. At some point it is no longer timely to plant the crop. Part of the planting decision will reflect the combination of lower commodity prices and potential yield declines driven by late planting. At least a few farmers may well decide to let things go this year.
Based on USDA’s June 19, 2017, Crop Progress report and the March 30 Prospective Plantings report, as of June 18, 2017, approximately 901,000 acres of corn and 4 million acres of soybeans had yet to be planted. Corn acres yet to be planted are concentrated in mid-Atlantic, Northeast, and Southwest states. Unplanted soybean acreage is concentrated in the corn belt, with nearly 1 million acres unplanted in Kansas and Missouri, combined.
Given the magnitude of unplanted corn and soybean acres, as well as the recent rainfall amounts, a portion of the corn and soybean acres unplanted may qualify to receive prevented planting payments. Prevented planting payments provide crop insurance benefits to policyholders to compensate for pre-planting costs incurred in preparation for planting the crop. For some farmers, these indemnity payments may exceed the economic returns associated with a late-planted and poor-yielding crop.
To provide some historical perspective on prevented plantings, today’s article reviews USDA’s Farm Service Agency Crop Acreage Data by crop year from 1996 to 2016. This set includes, among other information, county-level data on planted acres and prevented plantings for a variety of crops.
History of Prevent Planted Acreage
Acres designated as prevented plantings vary each crop year. From 1996 to 2016 the range of prevent planted acres for nine principal crops was as low as 1 million acres in 1997 to as high as 9.6 million acres in 2011, and over the last 21 years has averaged 3.7 million acres. Figure 1 identifies the prevent planted acreage by year for the major field crops.
Of the crops included in the FSA planted acreage data, corn, soybeans and wheat represent approximately 88 percent of the principal acres each year. It follows then that they should also represent most of the prevent planted acreage. Since 1996, corn, soybeans and wheat account for 34 percent, 23 percent and 30 percent of prevented plantings, respectively.
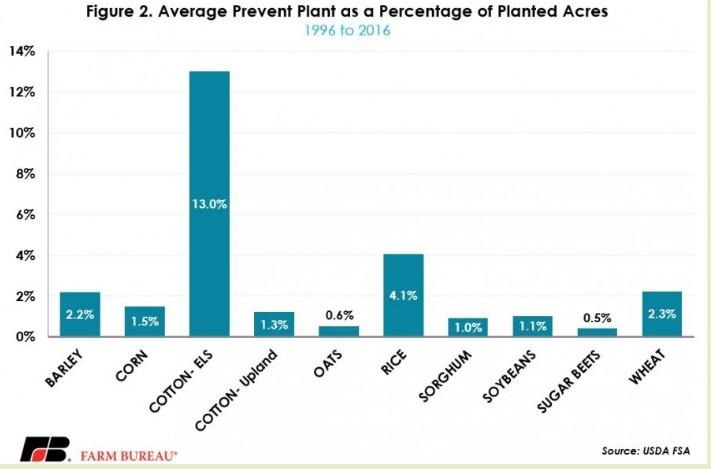
On average, there are 1.3 million, 804,000, and 1.2 million acres of corn, soybeans and wheat prevent plantings each year, respectively. The proportion of prevented planted acreage to actual plantings remains small. As a share of actual plantings, prevent plantings vary by crop and range from a low of 0.5 percent for sugar beets to a high of 13 percent for extra long staple cotton, Figure 2.
While adverse weather events are generally not systemic, there does tend to be geographic concentration of prevented planting acreage. Data shows that the frequency of prevented plantings is greater in the Upper Midwest and along the Mississippi River. Since 1996, more than 78 million acres have been classified as prevent plant, with the Dakotas, Minnesota, Arkansas and Missouri representing more than 50 percent of all prevent planting area. During the 21-year period analyzed, 70 counties had prevented plantings during all years, and an additional 1,121 counties had prevented plantings at least 50 percent of the years.
The distribution of prevented plantings acres highlights the spatial risk in crop production. In northern planting regions, the planting window is very narrow, and unfavorable weather could prevent acreage going into the ground. Similarly, areas prone to flooding are more likely to see prevented plantings when the spring rainfall is well above average. Figure 3 identifies average prevent planted acreage by county since 1996, and figure 4 identifies the county-level frequency of a prevented planting designation.