These automated Learning Blocks™ are implemented without any manual control by the grower during planting. The learning blocks help to answer questions such as “was this good economics against my average rate that I would normally apply uniformly across the field?” or “was the prescription rate that is applied within a specified management zone the correct rate?” If you are just getting started, and the management zones defined are not built on enough data that accurately defines the variability in that field, then the learning blocks help to understand what worked well and what did not work well in the prescription map.
A major part of the Grain Farmers of Ontario project is the development of a web portal by collaborators at Niagara College. The portal is both a data repository for the project and a transparent technology demonstrator for the tools needed to do precision ag. The portal, accessed online, houses all of the various data layers from each farm and has built-in algorithms and tools for cleaning and analyzing data. It allows farmer and crop consultant collaborators to upload and manipulate their own data, while the researchers can access and analyze the data of all participants – it makes uploading and sharing data easy amongst project collaborators.
Other commercial software platforms also offer the tools needed to automate seeding rate checks spatially across each field. Figure 2 shows a similar approach in SMS Advanced desktop software from AgLeader. This is a template from Veritas of Chatham Ontario, where blocks are the width of the planter and align with the direction of planter passes. The post-harvest analysis of the management zone and the block performance is also relatively automated and results in an economic report provided by Veritas to each of their clients.Figure 2. 2015 Variable Rate corn population map with checks built into the prescription map (Source: Veritas http://myveritas.ca/ )
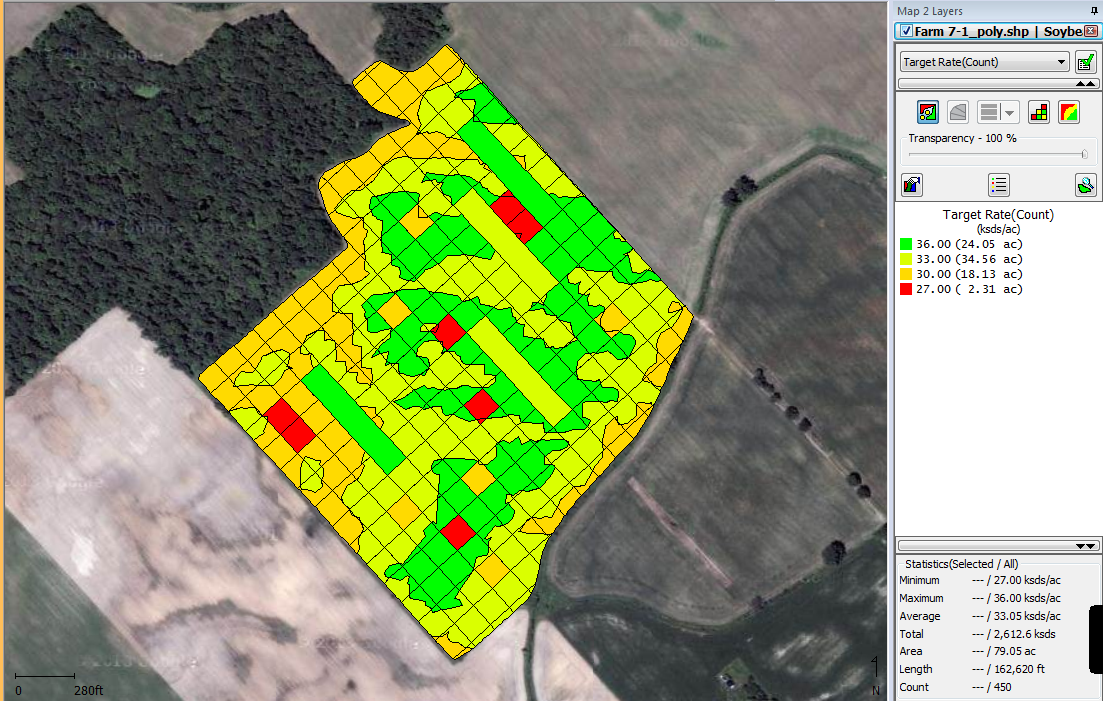
Figure 2. 2015 Variable Rate corn population map: yield potential index (YPI) zones built in Niagara College portal then checks built into the prescription map (Source: Veritas http://myveritas.ca/)
Stay tuned for more reports on the precision ag project initiated by Grain Farmers of Ontario. Right now the collaborators are busy conducting PSNT sampling and developing sidedress variable rate nitrogen strategies with automated checks built into the maps. Project staff are also out doing manual population counts across zones and within learning blocks and strips.
For more information on the Grain Farmers of Ontario project and how the management zones are being created tune into the project website: http://www.gfo.ca/Research/UnderstandingPrecisionAgriculture.aspx There is also a Grain Farmers of Ontario magazine article series being written by OMAFRA staff on the fundamental data pieces of a precision ag approach (Note: archived article shown on the bottom right of this webpage). This is an 8 part series which describes the different data layers that might be purchased or collected as part of a precision ag strategy and how they can be combined to develop prescription maps.
This project is funded in part through Growing Forward 2 (GF2), a federal-provincial-territorial initiative. The Agricultural Adaptation Council assists in the delivery of GF2 in Ontario. Funding has also been provided by Grain Farmers of Ontario.
Source: Fieldcropnews