Soil textural triangle
Clay minerals: What are they and why do they matter?
 |
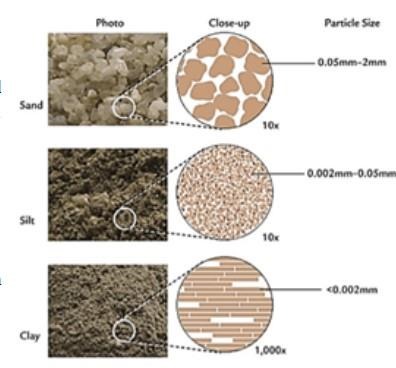
| Particle size and description |
Clay minerals are more complex than sand and silt particles. First, sand and silt particles sit in the soil like marbles stacked in a jar with the space in between for water and air movement (pore space). Clays are different; they sit like pages of a book, all stacked on top of each other. We consider them “layered,” and these layers are what make clays unique in their interaction with ions, like potassium.
There are two main features of clay layers that impact K:
- Cation Exchange Capacity (CEC): Differences in the chemical structure of clay layers provides negatively charged sites that can bind ions (potassium, calcium, magnesium, etc.). These charges largely determine a soil’s cation exchange capacity (CEC – see review below).
- Interlayer Space: The space between the layers can be large enough of a K ion to get “stuck.” Potassium ions stuck in the interlayer space are often called “Fixed K.” Interlayer space can also be large enough that ions like potassium (K+) can flow in and out of the interlayer.
Main Clay Types
While there are many types of clay minerals, we are focusing on three clay minerals that are common in Minnesota and the Midwest:
- Kaolinite: low CEC; no interlayer space
- Illite (mica): moderate CEC; interlayer space that can trap (fix) K+
- Smectite: highest CEC; interlayer space that shrinks and swells based on the water content of the soil; can trap or release K
What do we know so far about K and clay type?
Using previous field trial data and recent on-farm trials, we created a large database of soil K test data across Minnesota. Soils from the K trials were tested for K level and for the type and quantity of clay minerals (i.e. Kaolinite, illite, and smectite).
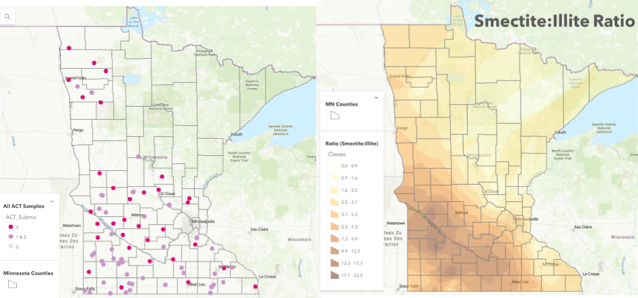
No soil has all smectite or all illite clay. Soils have a mix of many clay minerals but may be dominated by one type of clay mineral. To simply our data, we looked at the ratio of smectite to illite minerals to determine high smectite soils from high illite soils. The ratio (smectite/illite) break point used was 3.5.
Comparing the two clay groups, we saw a difference in critical K level. The critical K level can mean a lot of things to crop producers, but in this case we identify the critical K level as the point where 95% of maximum yield is achieved, which is typically around our medium soil test classification. In illite-dominated soils, the critical K level was lower:
 |
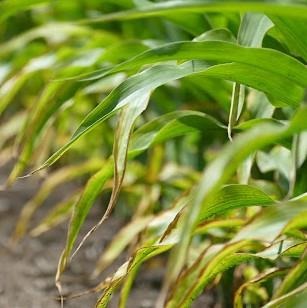
| Potassium deficiency in corn |
- High illite soils: critical K level of 85 ppm
- High smectite soils: critical K level of 106 ppm
What does this mean for farmers?
In higher illite soils, we need a lower soil test K level to maximize yields. So in higher illite soils, we may need to apply less K fertilizer to attain maximum corn and soybean yields since the critical STK level is lower.
Mapping Clay types in Minnesota
Learning that soil test K levels differ by clay type might have growers asking: What type of clay do I have on my farm?
Mineralogy tests are expensive (upwards of $300 per sample) and require sending samples to a special lab that has the capacity to test mineral fractions of the soil. To help Minnesota farmers avoid this cost, we are building mineralogy maps of the state that growers can use.
Clay mineral abundance is not like nutrient levels, which can vary substantially within fields. Rather, clay mineral abundance follows large-scale soil formation and will likely not vary within fields or even farms. With samples from all over the state, we have begun to create useful maps that will show relative abundance of smectite, illite, kaolinite, and other clay minerals (i.e. K feldspars). We will also map useful ratios, like the ratio of smectite to illite.
Watch our progress live
To see our current maps and watch our progress as we build the maps, visit our mapping site: z.umn.edu/MNclayMaps

What’s next for the K guidelines?
Only about half of the samples we have taken have been included in our analysis so far. (The light purple points on the map above have not yet been analyzed.) Once we receive mineralogy data for the remaining samples, we will add those points to our analysis and mapping efforts. Growers can expect to have improved and more accurate maps once these samples are added. As of now, we do not have any changes to the K recommendations for corn and soybean based on mineralogy tests, but growers should expect to see updates in the future.
View the current fertilizer guidelines for corn and soybeans.
Source : umn.edu