Population trends can reveal much about a community’s economic vitality. More people can lead to new opportunities for businesses and workers, and new homeowners and businesses can grow the local tax base to support public services and local schools. By contrast, places losing residents—particularly those of prime working age (25 to 54)—may have trouble meeting their local workforce needs or maintaining their tax base. The U.S. Census Bureau’s Population Estimates Program provides annual population estimates for all U.S. counties and these data allow us to better understanding how these trends are shaping communities across the country.[1]
Two primary factors drive population change—natural change (births minus deaths) and migration (domestic and international). Johnson (2023a) showed that the Great Recession profoundly affected U.S. demographic change over the subsequent decade. Poor economic conditions in many communities froze people in place, which in turn slowed domestic migration in many areas. Between 2010 and 2020, this was especially pronounced in nonmetro counties that experienced net out-migration and minimal or negative natural increase. As a result, two-thirds of nonmetro counties nationwide lost population during that period.
More recently, the pandemic disrupted these population dynamics and the population in some parts of rural America has rebounded. Recent gains in nonmetro counties resulted primarily from the reversal of domestic migration trends. Despite these gains, the U.S. population only grew 0.5% between 2020 and 2022—the smallest two-year increase in history (Johnson, 2023b). This growth has been slowed by a significant increase in deaths. In 2022, an estimated 75 percent of U.S. counties had more deaths than births; by comparison, only half of U.S. counties had more deaths than births in the years immediately prior to the pandemic (Johnson, 2023b).
This brief reviews U.S. population trends, and specifically those in the 12 states of the North Central region.[2] Particular focus is given to how these trends vary according to county urban and economic characteristics in the North Central region.
The North Central United States remains a relatively slow growing region
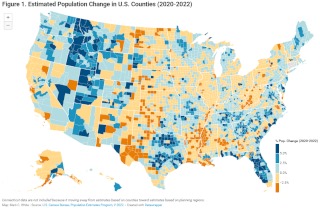
The U.S. population grew marginally between 2020 and 2022, the North Central United States lost 0.3% of its population during this period as the region’s larger states—Illinois (-1.6%), Michigan (-0.4%), and Ohio (-0.4%)—experienced the greatest losses. South Dakota (2.5%) and Indiana (0.7%) were the only two states in the region that grew more than the nation between 2020 and 2022. However, great variation occurs between and within states and regions. Figure 1 shows the estimated county population change over the past two years.[3] The fastest population growth often took place in parts of the South and the Intermountain West. Conversely, the most notable population losses occurred in parts of the Northeast, Midwest, Great Plains, and the Mississippi Delta among others.
Population trends within the North Central United States vary along the urban-rural continuum
Prior to the pandemic, the nation’s largest counties (greater than 1 million residents) and smallest counties (less than 30,000 residents) were both losing population, largely through net domestic out-migration (Rogers, Perry, and Spell, 2023). The first year of the pandemic disrupted these trends in different ways. For instance, fear of proximity brought on by the pandemic and greater virtual work opportunities accelerated the movement away from dense urban areas (Frey, 2023). By contrast, smaller nonmetro counties—which had lost residents over the previous decade—saw net domestic in-migration during the pandemic’s first year. These gains, however, were not solely the result of new residents moving into more rural counties. Rather the pandemic froze many people in place, so fewer rural residents left. As the nation recovered, both these trends abated between 2021 and 2022.
As shown in Figure 2, the influence of these urban characteristics on population trends was also evident within the North Central region.[4] Much like large central counties nationwide, many large counties (e.g., Cook County, IL; Ramsey County, MN; St. Louis City, MO) within the North Central region experienced significant population losses between 2020 and 2022.[5] These losses resulted primarily from net domestic out-migration.
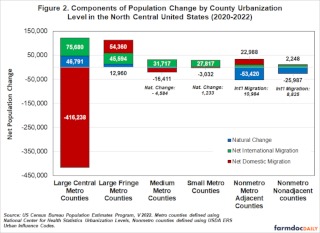
Although these central metro counties lost population, many residents did not leave the metro area altogether. The commercial real estate firm, CB Richard Ellis, analyzed U.S. Postal Service change of address data and found that most moves during the pandemic were to nearby counties (CB Richard Ellis, 2021). Within the North Central region, large fringe metro counties in places like suburban Minneapolis, St. Louis, Indianapolis, or Columbus experienced positive net migration and natural increase. This indicates that families and people of working age move to, and reside, in those suburban counties. These trends are not new but greater adoption of flexible work arrangements—at least among white collar workers—has enabled further suburban growth.
Both medium and smaller metro areas had small net population gains between 2020 and 2022, due in part to net international in-migration. Nevertheless, these two types of metro areas experienced different population dynamics during the pandemic. During the first year of the pandemic (2020 to 2021) medium-sized metros in the North Central region lost population from net domestic out-migration, whereas smaller metro areas gained net domestic in-migrants. During the second year (2021 to 2022), those trends had reversed themselves with medium-sized metros gaining population through net domestic in-migration and smaller metros losing domestic residents.
In aggregate, the population in more rural U.S. nonmetro counties grew less (0.3%) than the nation (0.5%) between 2020 and 2022. By contrast, nonmetro counties in the North Central region lost population during this period (-0.1%). Natural decline (more deaths than births) played a significant role in leading to declining populations in the North Central region’s rural counties. Rural populations tend to have older populations, poorer health, and lower COVID vaccination rates (Sun and Monnat, 2022)
These losses were, however, somewhat offset by positive gains from migration—particularly in rural counties adjacent to metro areas. In the North Central region, nonmetro metro adjacent counties had consistent net in-migration over the course of the past two years. Compared to more remote counties, these metro adjacent counties tend to be larger and benefit from greater relative proximity to the amenities, resources and opportunities found in metro areas. Provided this growth continues, metro areas will eventually absorb these metro adjacent counties. Since fewer people moved during the height of the pandemic, net domestic out-migration in nonmetro nonadjacent counties paused during the first year of the pandemic but then appeared to resume between 2021 and 2022.
County economic characteristics also shape population trends
Counties with different types of economies responded differently to the pandemic. As a result, this section considers the population trends in the North Central United States based on the USDA Economic Research Services’ County Economic Types.[6] Figure 3 shows how the components of population change in four of these county economic types—farming, manufacturing, government, and recreation dependent counties.
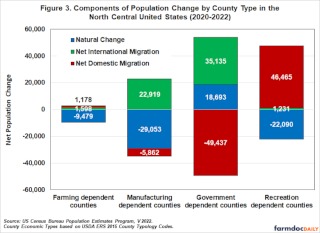
- Farming-dependent counties in the North Central United States lost population (-0.4%) between 2020 and 2022. These losses were driven primarily by natural decline. Although these counties gained population through net domestic in-migration over the past two years, those gains occurred between 2020 and 2021. Net domestic out-migration resumed in North Central farming-dependent counties between 2021 and 2022.
- Both natural decline and net domestic out-migration caused population losses in the North Central region’s Manufacturing-dependent counties. Some of these challenges are specific to the region, as manufacturing-dependent counties nationally experienced natural increase over the past two years. Net losses from domestic out-migration slowed between 2021 and 2022 and net international in-migration offset some of these population losses.
- Government-dependent counties include those with significant employment and earnings derived from public schools and universities, prisons, military bases or other significant state and federal government activities. Within the North Central region, counties with large state universities are some of the most prominent government-dependent counties (e.g., Champaign County, IL; Washtanaw County, MI; Johnson County, IA; Tippecanoe County, IN). During the first year of the pandemic, these counties experienced significant net domestic out-migration. These losses were mitigated by net international migration and natural increase, leading to overall marginal growth between 2020 and 2022.
- Nationally, Recreation-dependent counties grew more than twice as fast as the nation overall and the North Central region’s recreation counties mirrored this trend. Growth was driven by net domestic in-migration as recreational and natural amenities drew new residents to these counties. These new residents are often older and in aggregate these counties had more deaths than births. In more retirement-oriented areas (e.g., the Branson area in Missouri), recreational counties may face challenges from workforces that are not growing at the same pace as their population.
The North Central United States is a relatively slow growing, but population growth patterns vary throughout the region.
The North Central region remains a relatively slow growth region with some persistent population challenges in large core metro counties and some more remote rural areas. However, growth is occurring in places (e.g., suburban or rural metro adjacent counties) where residents can still access the opportunities, resources, and amenities available within metro areas. Smaller and/or nonmetro counties with access to recreational and natural amenities also continue to grow and attract new residents. Moreover, international migration has also made important contributions to population growth in different types of counties throughout the region. It remains to be seen how permanently the pandemic changed the trajectory of regional population growth trends as, for instance, greater adoption of hybrid and remote work arrangements appears a new feature of the workforce.
Notes
[1] These estimates are produced annually to show intercensal population trends and the components of population change (e.g., natural change, net migration). For each year, these estimates measure the population change from July 1 to June 30. They use the Decennial Census as benchmark, so the 2020 estimates are very close to the Census population counts. With each annual release, the Population Estimates Program revises and updates the entire time series back to the previous Decennial Census. Readers should remember that these data are estimates, although the Census Bureau uses the best data and methods available to them.
[2] The North Central region is defined here as the states of Illinois, Indiana, Iowa, Kansas, Michigan, Minnesota, Missouri, Nebraska, North Dakota, Ohio, South Dakota, and Wisconsin.
[3] Data for Connecticut are not included because it is in the process of redefining the geographies for how these data are published by switching from counties to ‘county equivalent’ planning regions.
[4] Metropolitan Statistical Areas (MSAs) are defined by the U.S. Office of Management and Budget and are based on the size of urbanized areas in a central county; surrounding counties are included based on their economic integration (as defined by commuting levels) with the core county. The county urbanization levels for metro counties are based on definitions created by the U.S. Department of Health and Human Services’ National Center for Health Statistics. Large central metro counties are defined as those in MSAs with 1 million or more people and contain the entirety or a significant portion of the MSA’s principal city. Large fringe metro counties are those within MSAs of more than 1 million people and do not qualify as large central metro counties. Medium metros are counties in MSAs with populations greater than 250,000 and less than 1 million. Small metro counties are in MSAs with populations less than 250,000. The nonmetro counties were defined using USDA Economic Research Service’s 2013 Urban Influence codes. Nonmetro Metro Adjacent counties are nonmetro counties that border metro areas. Nonmetro Nonadjacent counties do not share a border with any metro area.
[5] Figure 1 identifies each county according to their urban-rural designation and economic type.
[6] USDA ERS’ 2015 County Typology Codes classify all U.S. counties into six mutually exclusive categories of economic dependence. Figure 3 focuses on the population trends in four of the six different types of counties. Two others mining-dependent and non-specialized were not included. The North Central region possesses relatively few mining-dependent counties (e.g., Missouri’s Lead Belt). Nonspecialized counties are often found in the region’s metro areas. More information about the county typology codes can be found on the USDA ERS website: https://www.ers.usda.gov/data-products/county-typology-codes/
Source : illinois.edu