Keep in mind that the potential ear size and potential number of kernel (1,000-1,200 per ear) are set before silking, but the actual final number of kernels is not determined until after pollination and early grain fill due to relative success of fertilization and degree of early abortion.
Always keep the long-term weather conditions in mind. In a drought year, almost any corn seeding rate is too high for the available moisture in some areas. Although it’s not a good idea to make significant changes to seeding rates based only on what has happened recently, it is worthwhile taking into consideration how much moisture there is currently in the soil profile and the long-term forecasts for the upcoming growing season.
For this growing season, if you think weather conditions will be more favorable for corn this year than the past years, stay about in the middle to upper part of the range of seeding rates in the table below. If not and you expect dry subsoils, you might want to consider going towards the lower end of the range of recommended seeding rates, with the warning that if growing conditions improve, you will have limited your top-end yield potential.
The recommended corn seeding rate and final plant population in the following tables attempt to factor in these types of questions for the typical corn growing environments found in Kansas. Adjust within the recommended ranges depending on the specific conditions you expect to face and the hybrid you plan to use. Of course, do not forget to consult seed company recommendations to determine if seeding rates for specific hybrids should be at the lower or upper end of the recommended ranges for a given environment.
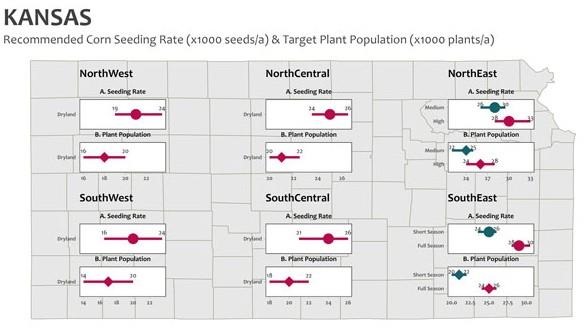
Figure 1. Suggested dryland corn final populations and seeding rates.
Table 1. Suggested irrigated corn final populations and seeding rates
Environment | Hybrid Maturity | Final Plant Population (plants per acre) | Seeding Rate* (seeds per acre) |
Full irrigation | Full-season | 28,000-34,000 | 33,000-40,000 |
Shorter-season | 30,000-36,000 | 35,000-42,500 |
Limited irrigation | All | 24,000-28,000 | 28,000-33,000 |
* Assumes high germination and that 85 percent of seeds produce plants. Seeding rates can be reduced if field germination is expected to be more than 85%.
K-State research on corn seeding rates
An intensive review of a large database from Corteva Agriscience (2000-2014 period) was utilized to synthesize yield response to plant population under varying yield environments (<100 bu/acre to >200 bu/acre). Overall, yield response to plant population depended on the final yield environment (Figure 2). In yield environments below 100 bu/acre, yield response to plant population was slightly negative. Yield response to plant population tended to be flat when yield environment ranged from 100 to 150 bu/acre; positive and quadratic with the yield environment improving from 150 to 180 bu/acre; and lastly, increasing almost linearly with increasing plant populations when the yield environment was more than 200 bu/acre (Figure 2).
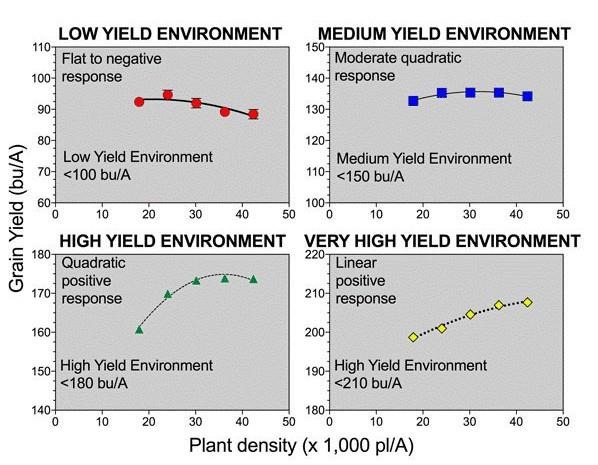
Figure 2. Corn grain yield response to plant density in four yield environments, a) <100; b) 100-150; c) 150-180; and d) > 180-210 bu/acre (Assefa, Ciampitti et al., 2016, Crop Science Journal).
As a disclaimer, “agronomically” optimum plant population does not always coincide with the “economically” optimal plant population. Lastly, final seeding rate depends on the environment, hybrid, and production practices (e.g., planting date, rotation, tillage). Also keep in mind the corn yield response to plant density curves also present an uncertainty level (error) based on many other unaccounted factors affecting yields.
A step-forward in our research study on yield response to plant density is taking advantage of progress in digital agriculture, which brings the opportunity to develop decision-making frameworks to manage risk and uncertainties of farmers when selecting critical inputs such as the seeds. Thus, we are working on tuning forecast models based not only on the yield environment (or an average of past yield data), but also considering type of soils, scenarios of available water at planting, and weather forecasts for the growing season (Figure 3). Thus, we are committed on including the risk level taken by farmers when selecting plant density as a relevant point of investigation in our future studies.
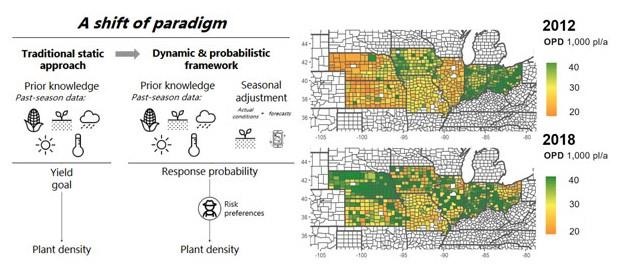
Figure 3. Optimal plant density forecast across the Midwest region considering two contrasting seasons: 2012 (dry) and 2018 (wet). Adapted from Lacasa et al. 2021.
Source : ksu.edu