Background
MP is an area plan of insurance that provides protection against changes in operating margins, including measures of both revenue and costs (see farmdoc daily August 30, 2022 and a more detailed explanation in farmdoc daily, September 8, 2017). Although MP provides coverage against unexpected decreases in operating margins, it is an area plan and input prices used to calculate margin are not farm prices. For these reasons, MP does not provide margin risk protection at the farm level.
The policy pays based on a change from an expected margin to harvest margin, with the margin for both based on revenue minus costs set over a specified period for each.
Revenue Components
The revenue side of the margin calculation includes components of yield and commodity price.
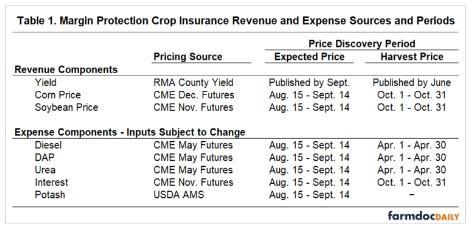
Yield is based on county yields published by United States Department of Agriculture (USDA) Risk Management Agency (RMA). The expected yield is the same expected county yield used for Area Risk Protection crop insurance plans and is published by September for the upcoming crop year. The harvest yield is calculated by county based on crop insurance records and is published by June following the crop harvest (see Table 1).
Commodity prices are set using Chicago Mercantile Exchange (CME) December futures contract of the crop year for corn and November futures contract of the crop year for soybeans. For 2023 MP policies, this is the December 2023 future contracts for corn and November 2023 futures contract for soybeans (see Table 1).

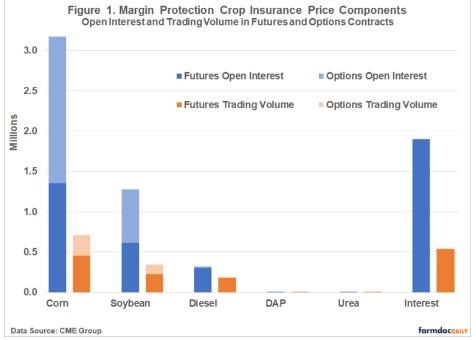
Corn – based on CME Corn (ZCZ2) with contract unit of 5,000 bushels. Over the last 30 trading days open interest in ZCZ2 has ranged between 1.2 million and 1.4 million contracts with daily trading volume ranging from 144,000 to over 453,000 trades. To provide a better picture of market liquidity, corn options have open interest of more than 500,000 contracts currently, and over 20,000 trades per day in the past 30 trading days.
Soybeans – based on CME Soybeans (ZSX2) with contract unit of 5,000 bushels. Over the last 30 trading days open interest in ZSX2 has ranged 570,000 and 620,000 contracts with daily trading volume ranging from 97,000 to 225,000 trades. To provide a better picture of market liquidity, soybean options have open interest of more than 550,000 contracts currently, and over 20,000 trades per day in the past 30 trading days.
Cost Components
The cost side includes components of inputs subject to price changes and those not subject to price changes. Fixed-price inputs not subject to price changes for MP are seed, machinery operating costs (besides fuel), and similar expenses. Inputs subject to price changes for corn are diesel, interest diammonium phosphate (DAP), urea, and potash. Aside from urea, soybeans have the same set of inputs subject to price changes.
For pricing on diesel, DAP, and urea inputs, the CME May futures contract of the crop year is used. For 2023 MP this is the May 2023 contract. The expected price is set using the average value of the futures contract during the August 15 to September 14 price discovery period. For 2023 MP this is the value of the May 2023 futures contract between August 15 and September 14, 2022. The harvest price is set using the average value of the futures contract during April. For 2023 MP this is the value of the May 2023 futures contract between April 1 and April 30, 2023 (see Table 1).
For pricing on interest rates, the CME November futures contract of the crop year is used. For 2023 MP this is the November 2023 contract. The expected price is set during the same price discovery period as the other inputs, but harvest price is set based on the average value of the future contract during October. For 2023 MP this is the value of the November 2023 futures contract between October 1 and October 31, 2023 (see Table 1).
Diesel – based on CME NY Harbor Ultra Low Sulfur Diesel (HOV2) with contract unit of 42,000 gallons. Over the last 30 trading days open interest in HOV2 has ranged between 260,000 and 300,000 contracts with daily trading volume over 100,000. To provide a better picture of market liquidity, options have open interest of over 17,000 contracts currently, and daily trading volume ranges between 40 to over 1,100 trades per day over the past 30 trading days.
DAP – based on CME DAP Freight-on-Board New Orleans (DFN) with contract unit of 100 tons. Over the last 30 trading days open interest in DFN has ranged between 195 and 270 contracts with trades on only 9 days and highest volume traded on one of those days at 45. There is no options trading for DAP.
Urea – based on CME Granular Urea Freight-on-Board at US Gulf (UVF) with contract unit of 100 tons. Over the last 30 trading days open interest in UVF has ranged between 1,500 and 1,900 contracts with trades occurring on most, but not all, days. On days traded trading volume ranged from as low as 2 to nearly 300. There is no options trading for urea.
Interest – based on the CME 30 Day Federal Funds (ZQG3). Over the last 30 trading days open interest in ZQG3 has ranged between 1.5 and 2.0 million contracts. Daily trading volume ranged between 100,000 to over 500,000. Although available for trading, options for 30 Day Federal Fund are virtually unused (open interest is currently 1).
Potash – based on the USDA Agricultural Marketing Service (AMS). For MP 2023, the MP website is currently basing this on the 8/11/22 AMS Cost of Production Report Value which is $856.50. The price is captured one time during the price discovery period. That value is used for both expected price and harvest price in the MP calculation.
During the price discovery period, costs are published daily at www.marginprotection.com.
Discussion
While futures contracts for corn and soybeans and heavily traded, the futures contracts used to set input prices for DAP and Urea and thinly traded (see Figure 1). There are a small number of contract holders and low trading volume. A single move can cause noticeable changes in the market price. While this may not be a concern, there is a possibility of a single market participant having a large influence on price.

Although potash is included as an input subject to price change, the price of potash does not change. The potash price is set one time and the value is used for both expected price and harvest price in the MP calculation. For farmers, the price of potash does change throughout the season. As an example, for 2022 MP policies the price was set during the August 15 to September 14, 2021 price discovery period at $629.10. In April 2022 when harvest price is set for other inputs, the average USDA AMS cost of production value for potash was $861. Although farmers were paying more than $200 more per ton, the influence of that impact on farm margins was not captured in the MP calculation.
Urea is the form of Nitrogen used as an input component in MP, but an anhydrous ammonia is the more widely used form of Nitrogen by farmers for corn and soybeans. Although prices of urea and anhydrous ammonia have been strongly correlated over the past 15 years, there is statistically greater variance in anhydrous ammonia price. This means that the price change farmers are subject to may be much larger than what MP is capturing. Using USDA AMS cost of production report values to provide a comparison, the price of anhydrous ammonia increased approximately 110% between August/September 2021 and April 2022 while the price of urea increased approximately 70% in the same time frame.
Summary
There are serious constrains on the risk management usefulness of MP, particularly when input prices are volatile, which is likely when farmers are most interested in purchasing MP. Farmers are informed MP is an area plan not intended to reflect an individual farm situation. But given how inputs are set, actual farm costs can deviate from margin changes captured by the MP program. It is important to understand these differences and the implications that could have on margin changes on the cost side of the payment calculation. Despite these differences MP does allow the projected price for the commodity to be set earlier than other insurances. Farmers may find that option of value in 2023, as commodity prices during the current August 15 to September 14 price discovery period are relatively high for setting price on the revenue side of the margin equation.
Source : illinois.edu