By Michelle Leinfelder-Miles
The 2012-2016 drought was one of the worst droughts in California history, not solely for the lack of precipitation, but also for its length, high temperatures, low snowpack, and water demand. It's probably safe to say that it won't be our last drought – or even our worst – as we look into the future. That said, what can we do in the California alfalfa industry to better manage for drought and the likely salinity impacts from a lack of water?
Water Management during the Growing Season: Dan Putnam wrote a blog article, “Why Alfalfa is the Best Crop to Have in a Drought” (
http://ucanr.edu/blogs/blogcore/postdetail.cfm?postnum=17721), which describes the water use of alfalfa compared to other crops, its adaptations to water-stressed conditions (like being deep-rooted), and ways we can adapt our management in low-water years. In particular, during the growing season, we can optimize water use and alfalfa growth during the early part of the season when yield and quality are highest, and dry down in the later part of the season. Dan's research has shown that the alfalfa will survive and resume growth when moisture conditions become favorable.
Water Management during the Winter Season: In 2013 through 2015, I cooperated with alfalfa growers in the Delta region to understand soil salinity conditions and leaching fractions in fully irrigated fields. I then modelled soil moisture and salinity conditions to understand these conditions during the winter season to help inform our management during the off-season.
Figure 1 (below) shows the daily water balance (precipitation minus crop evapotranspiration, ETc) and the change in soil moisture from field capacity (i.e. soil moisture after free drainage has ceased) at seven alfalfa fields during Winter 2013-14. This figure helps us to visualize why precipitation, particularly in a drought year, is not contributing more to soil moisture for early spring growth or to leaching salts. Total rainfall was approximately 8.2 inches, and for only a few storms (shown as peaks) was there enough precipitation to exceed crop water use (ETc).
The other lines on the graph (labelled Sites 1-7) illustrate the soil moisture deficit from field capacity. Soil moisture is expressed relative to field capacity because a primary interest in this modelling was to understand how much water is available for leaching salts. Until a soil reaches field capacity, we assume the water is held in the soil and not available for leaching. For all sites, the soil was drier than field capacity in the fall after the last cutting and before the first rain event. The lines decrease (i.e. become more negative) until December 1st because crop water use exceeded precipitation, so the crop drew upon soil moisture. On December 1st, there was a rain event that was enough to exceed ETc, so the soil moisture deficit decreased, but soil moisture was still less than field capacity. This trend continued for the remainder of the winter. If there had been enough precipitation to increase soil moisture above field capacity, then water would have been available for leaching, but this did not happen in Winter 2013-14. Precipitation rarely exceeded ETc, and each alfalfa site remained at a soil moisture deficit over the entire winter. In other words, precipitation was never high enough to fill the soil profiles, exceed the soils' field capacity, and leach salts.
Figure 2 (below) represents conditions for water year 2014-15. Total rainfall was approximately 11.8 inches, and precipitation exceeded ETc more frequently than in water year 2013-14. There was a period starting on December 11th where soil moisture exceeded field capacity (for all but Site 5), providing water for leaching. The highest peak on each site's line represents the total water available for leaching after accounting for ETc and filling the soil profile to field capacity. This peak occurred on December 20th and was 0.8, 3.3, 1.1, 1.8, 0, 1.4, and 1.2 inches, for Sites 1-7, respectively. (Site 5 was 0 inches because the soil moisture deficit remained the entire year; thus, zero water was available for leaching.) As this water was available for leaching, we assume that this water drained from the profile, and the lines drop to zero, or field capacity. Beyond December 20th, the daily water balance was never enough to exceed field capacity for any of the sites. (Note: the lines for all sites, except Site 5, overlap after December 20th.) So, no other water was available for leaching over the remainder of the winter season.
Conclusions: The 2012-2016 drought provided limited ability to manage salts with winter rainfall. For seven Delta alfalfa sites, we modelled 0 inches of rainfall available for leaching in Winter 2013-14. We modelled a range of about 0 to 3 inches of rainfall available for leaching in Winter 2014-15, depending on location. As a result, root zone soil salinity decreased in Spring 2015 (data not shown). When winter rainfall is not adequate for effective leaching, however, we need to be creative in our leaching strategies. Leaching during the season may not be advisable for crop health and nutrient management reasons, but we may be able to leverage winter rainfall with irrigation by wetting the soil profile before a rain event. A soil profile that is brought to field capacity with irrigation would likely result in rain water passing through the profile and leaching salts, rather than just soaking into a dry soil. We should also consider field modifications that improve irrigation efficiency prior to planting alfalfa, like increasing on-flow rate, narrowing border checks, or shortening field length, where possible. While drip irrigation in alfalfa is still not widely employed, in those fields that have it, it might be wise to also maintain a surface irrigation system for leaching. Our options are not many, but they could provide some relief when water is scarce.
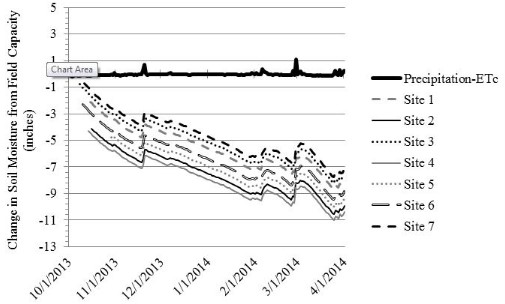
Figure 1. The daily water balance (i.e. precipitation minus ETc) and the change in soil moisture from field capacity for Winter 2013-14 at seven Delta alfalfa sites. This model shows that there was no water available for leaching. All rainfall was soaked up and held by the soil.
Figure 2. The daily water balance (i.e. precipitation minus ETc) and the change in soil moisture from field capacity for Winter 2014-15 at seven Delta alfalfa sites. This model shows that there was some water available for leaching in mid-December, ranging from about 0-3 inches, depending on location.