By Scott Irwin and Todd Hubbs
Department of Agricultural and Consumer Economics
University of Illinois
Wet conditions in much of the Corn Belt continue to hamper corn planting progress this spring. The USDA’s most recent weekly
Crop Progress report indicated that only 15 percent of the corn acreage in 18 major producing states was planted as of April 28, compared to a five-year average of 25 percent. These conditions naturally lead to concerns that more than the average percentage of U.S. corn acreage will be planted late. In our farmdoc daily article last week (
April 24, 2019), we concluded that recent wet topsoil conditions in the Corn Belt did not bode well for planting the entire U.S. corn crop in a timely manner, despite the fact that nearly of month remained until the cutoff for late planting (May 20). We argued that a conservative estimate of late corn planting in 2019 was at least 5 to 10 percent above average. The purpose of this article is estimate the implications of projected late planting for the 2019 U.S. average corn yield.
Analysis
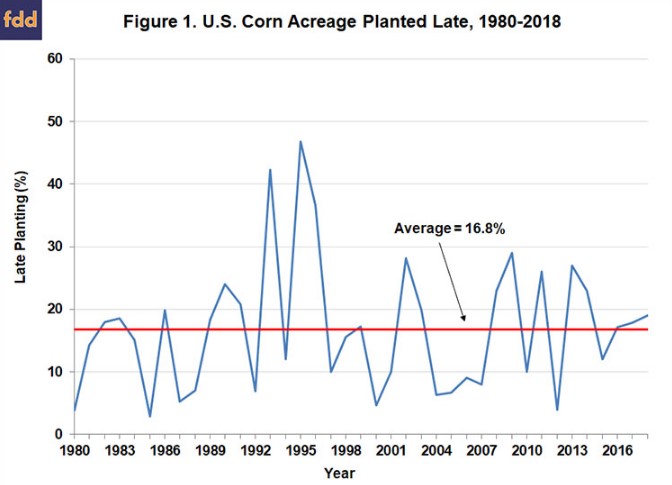
We begin by reviewing the estimates of late planting for corn presented in last week’s farmdoc daily article. Figure 1 shows the percentage of corn planted late in the U.S. over 1980-2018 based on a May 30 cutoff from 1980 through 1985 and a May 20 cutoff date from 1986-2018. The change in cutoff dates in the mid-1980s reflects recommendations for earlier planting that appeared around that time. On average, late planting based on this measure was 16.8 percent, with the bulk of the observations between about 5 and 25 percent. There is no evidence of a trend up or down over time in the late planting percentage, which suggests that producer behavior in aggregate with respect to late corn planting has been quite stable. The amount of late planting does vary substantially from year-to-year, ranging from a low of 2.9 percent in 1986 to a high of 46.9 percent in 1995.

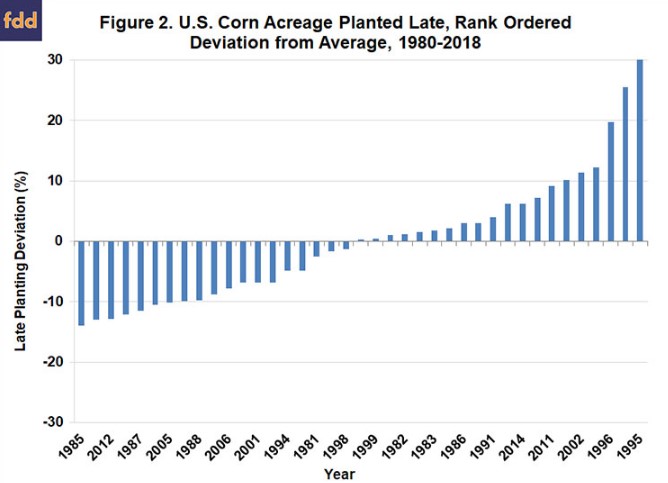
Figure 2 provides an alternative way of presenting the data on late corn planting. Here, the average late planting over 1980-2018 of 16.8 percent is subtracted from each annual observation and then the deviations from average are rank ordered from smallest to largest. Note that a negative number implies lower than average late corn planting and a positive number implies higher than average late planting. Presented in this manner, the data show that in most years late corn planting differs from the average by about +/- 10 percent, but there a handful of years when late planting is much higher than average. The years with especially high late planting were clustered in the mid-1990s (1993, 1995, and 1996) and the magnitude of late planting in these years ranged between about 20 and 30 percent above average.

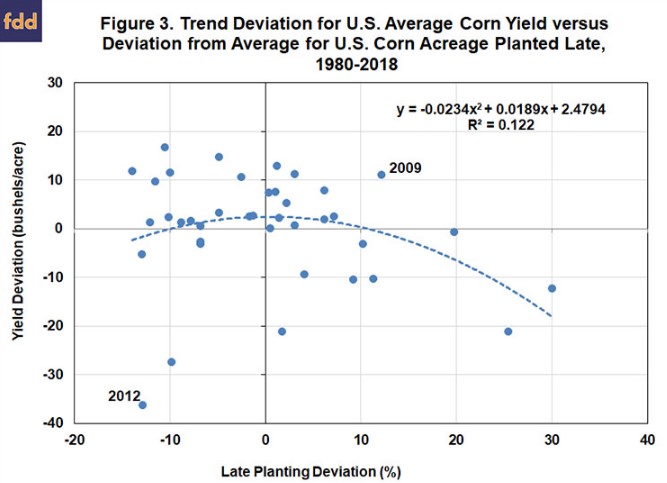
The next step of the analysis is to estimate the impact of late planting on the U.S. average corn yield. Figure 3 shows the relationship between the trend deviation for U.S. corn yield and the deviation from average for U.S. corn acreage planted late over 1980 through 2018. As expected, there is an overall negative relationship between late planting and corn yield deviations from trend. However, the relationship is highly non-linear, with a largely flat segment up to 10 percent above average late planting and then a steeply sloped segment for late planting that is 10 percent or more above average. Specifically, for late planting that is 10 percent or more above average the regression model indicates that for each 1 percent increase in late planting the national average corn yield drops by about 0.9 bushels per acre. The estimated regression relationship in Figure 3 nicely matches the curvature of planting date effects on corn yield estimated in agronomic field trials (e.g., farmdoc daily,
May 20, 2015; Nafziger, 2017).

It is important to emphasize that the explanatory power of the regression model in Figure 3 is quite low, as the R2 is only 12.2 percent. This does not mean that late planting should be ignored when projecting corn yield, but rather, other factors, in particular summer weather, are typically more important in explaining deviations from trend yield (e.g., Nielsen, 2015). Two years provide good examples. Late planting was well above average in 2009 but the corn yield was a record at the time due to a cool, wet summer. Conversely, late planting in 2012 was at the low end of the sample range but corn yield was extremely low relative to trend due to the severe drought that summer.
Given the low explanatory power of the regression model in Figure 3 one should treat the estimated relationship with a good deal of caution. An alternative and potentially more robust approach is to directly compute probabilities and average trend yield deviations for different categories of late planting—less than average, moderately more than average, and well-above average. Specifically, when late planting is below average (negative): i) the chance of corn yield being above trend is 69 percent; ii) the chance of being below trend is 31 percent; and iii) the average deviation from trend yield is +0.9 bushels per acre. When late planting is moderately above average (0 to 9.9 percent): i) the chance of corn yield being above trend is 79 percent; ii) the chance of being below trend is 21 percent; and iii) the average deviation from trend yield is +1.4 bushels per acre. The high chance of above trend yields in this category is simply a reflection of the flat nature of the response curve estimated in Figure 3. In contrast, when late planting is well-above average (10 percent or more): i) the chance of corn yield being above trend is only 17 percent; ii) the chance of being below trend is 83 percent; and iii) the average deviation from trend yield is -6.1 bushels per acre. This indicates that, in general, late planting does not provide much information about corn yield in years when late planting is below or moderately above average. But, there is a substantial impact of late planting when it is large, as in the six years with the largest level of late planting during the sample period (2013, 2002, 2009, 1996, 1993, and 1995 in that order).
The previous results suggest that the key issue for projecting the 2019 U.S. average corn yield at this point in the season is whether late planting will be 10 percent or more above average. In our farmdoc daily article last week (
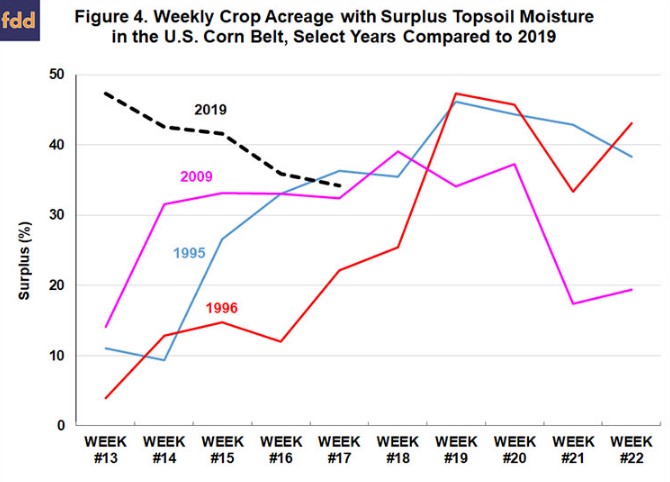
April 24, 2019), we found that when the topsoil moisture surplus in the Corn Belt is 30 percent or more on April 22 that late corn planting in the U.S. averaged 26.4 percent, or 9.6 percentage points higher than average. In Figure 4, we provide further perspective by plotting weekly values of topsoil moisture surplus in the Corn Belt during April (weeks #13 – #17) and May (weeks #18 – #22) for 2019 to date and the three years since 1995 that had the largest amount of late planting. We do not include 1993 because data for the Corn Belt topsoil moisture surplus measure is only available starting in 1995. The figure shows that 2019 to date has been wetter than 1995, 1996, and 2009 with one exception (2009 in the most recent week). Heavy rains this week almost certainly will increase topsoil surplus, and if current weather forecasts verify, will likely continue to increase the next two weeks. Note that 1995 and 1996 had drier Aprils than in 2019 and then experienced very wet Mays. The pattern for 2009 is similar except that wetness diminished considerably in the second half of May. Right now, 2019 appears headed for both a very wet April and a wet May, something that has not happened in the last 25 years, and this means that there is a low probability of having the number of suitable field days needed to plant the corn crop in a timely fashion before May 20th (see the farmdoc daily articles on
April 17, 2019 and
April 24, 2019 for further details on this type of calculation).

The above analysis of topsoil surplus moisture patterns in analog years suggests that late planting in 2019 is likely to be at least 10 percent above average. In particular, late planting in the three analog years of 1995, 1996, and 2009 averaged 22.6 percent above average, well beyond the 10 percent threshold. Given this conclusion, we can proceed to making projections of the 2019 U.S. average corn yield. In our
webinar after the March 30, 2019 USDA reports, we presented a linear trend yield projection of the 2019 national average corn yield of 175.4 bushels per acre. Assuming that late planting is 10 percent or more above average, we should have a reasonably high degree of confidence that the actual yield will be below this trend estimate. We can make various assumptions to estimate how much below trend. For example, if we consider all years over 1980-2018 with 10 percent or more late planting, our trend yield projection should be reduced by 6.1 bushels to 169.3 bushels per acre. Alternatively, if we consider only the three analog years of 1995, 1996, and 2009 with very late planting, the trend yield projection should be reduced by 7.4 bushels to 168.0 bushels per acre.
Implications
The impact of late planting on projections of the U.S. average corn yield is an important question right now due to the very wet conditions so far this spring through much of the Corn Belt. We estimate that the relationship of late planting with corn yield trend deviations is highly non-linear, with a largely flat segment up to 10 percent above average late planting and then a steeply sloped segment for late planting that is 10 percent or more above average. This nicely matches the curvature of planting date effects on corn yield estimated in agronomic field trials (e.g., farmdoc daily,
May 20, 2015; Nafziger, 2017). The key then for 2019 is whether late corn planting will be 10 percent or more above average, where the negative impact on corn yield is relatively large. Specifically, when late planting is 10 percent or more above average the chance of corn yield being below trend is 83 percent and the average deviation from trend yield is -6.1 bushels per acre. We analyze topsoil surplus moisture patterns in analog years to 2019 and the analysis suggests late planting this year is likely to be at least 10 percent. The implication is that there is a significantly elevated probability of a below-trend corn yield in 2019 and that present projections of U.S. average corn yield should likely be reduced to 170 bushels per acre or less. It is important to recognize that good summer weather conditions can offset the projected negative impact of late planting on the national average corn yield, but history indicates the probability of this happening is not very high if wet conditions in the Corn Belt persist through mid-May.