By Carl Zulauf
Department of Agricultural, Environmental and Development Economics
Ohio State University
Gary Schnitkey and Nick Paulson et.al
Department of Agricultural and Consumer Economics
University of Illinois
The ratio of per acre price of farm land relative to rent paid per acre for farm land has increased over the last 50 years and in particular since 2000. This increase is conceptually and statistically associated with a decline in interest rates. The Federal Reserve has indicated that it is embarking on a path of raising interest rates to dampen inflation. As interest rates rise, the ratio of farm land price to rent is likely to decline unless offset by other factors.
Land Price to Rent Ratio
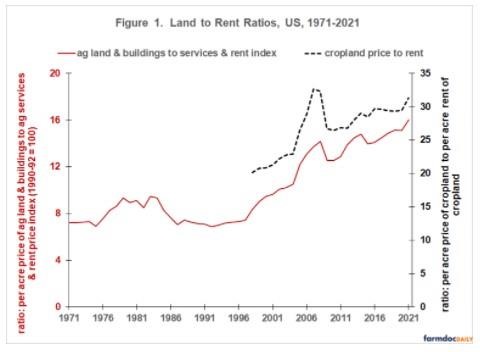
The ratio of farm land price to farm land rent is an example of a general type of ratio that relates an asset’s value to the income it generates. A ratio of farm land price to farm land rent for the US can be calculated starting in 1971. The specific ratio is [(average US per acre price of agricultural land and buildings) divided by (price index of agricultural services and rents)]. Values for these variables are contained in the US Department of Agriculture’s (USDA) Quick Stats data set. This ratio has trended upward, increasing 122% from 7.22 in 1971 to 16.01 in 2021 (see Figure 1). The upward trend became more pronounced after 2000 as the ratio has increased 69%.

A potential concern with this ratio is that the numerator includes buildings as well as land while the denominator includes agricultural services as well as rent. The ratio may thus change even if the farm land price-to-rent ratio does not change. However, a variable check exists. USDA has reported the US price of cropland and US cash rent paid for cropland since 1997 and 1998, respectively. These variables are also available in Quick Stats. Since 1998, the two land price-to-rent ratios have moved together (see Figure 1). Their correlation is +0.93 (1.00 is perfect correlation). Moreover, the changes from year-to-year in the two ratios have a correlation of +0.81, which is a strong relationship between year-to-year changes. This comparison suggests that the ratio of agricultural land and buildings to agricultural services and rent is a reasonable measure of the ratio of farm land price to farm land rent.
Land Price-to-Rent Ratio and Interest Rates
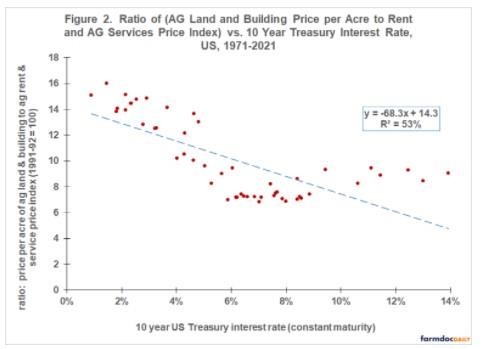
A basic model of asset pricing is that the price of an asset equals its discounted stream of future net returns. Rent is a net return to land. A conventional measure of the discount rate is an interest rate. Figure 2 presents the relationship between the farm land price-to-rent ratio and the 10 year US Treasury bill interest rate, a commonly watched, market-determined interest rate. Between 1971 and 2021, the 10-year US Treasury bill (constant maturity) interest rate averaged 6.1% with a range of 0.9% to 13.9%. For 2021, it was 1.5%. See the December 23, 2021 farmdoc daily article for a discussion of US 10-year Treasury bill rates since 1962).

The variation in the 10-year Treasury rate explains 53% of the variation in the agricultural land price-to-rent ratio. As expected, the relationship is negative. Higher interest rates are associated with lower land price-to-rent ratios. A 1 percentage point increase (i.e. 1%) in interest rate reduces the farm land-to-rent ratio by -0.683 (0.01 * -68.3). The relationship is significant with 99% statistical confidence.
Summary Observations
The ratio of per acre price of US agricultural land to per acre rent paid for agricultural land has trended higher over the last 50 years.
This ratio is negatively related to interest rates with 99% statistical confidence. For a given level of rent, the price of land increases (decreases) with decreases (increases) in interest rate.
The US Federal Reserve has begun increasing interest rates to control inflation.
To provide perspective on what higher interest rates may mean for agricultural land prices and assuming no other variable changes initially, an increase in the 10-year Treasury bill rate to its average value of 6.1% would result in a 20% decline in the price of farm land (calculations are in Data Note 1).
The decline could be larger. The preceding calculation does not consider that higher interest rates likely increase interest expense and thus lower rent. Interest expense is discussed in the farmdoc daily article of March 21, 2022.
The analysis found that the variation in the 10-year US Treasury rate explains 53% of the variation in the agricultural land price-to-rent ratio. In other words, 47% of the variation is unexplained. Given the size of unexplained variation, identification of other factors associated with the variation in the agricultural land price-to-rent ratio would be a useful area of research.
Data Note 1: The 20% decline is calculated as follows: (1) Change in 10-year US Treasury Interest Rate: 6.1% average rate – 1.5% rate in 2021 = 4.6%. (2) Change in Land Price to Rent Ratio: 4.6% * -68.3 = -3.14 percentage points. (3) Adjusted Land Price-to-Rent Ratio (to reflect increase in interest rate) = 16.01 (2021 ratio) – 3.14 = 12.87. (5) Change in Land Price = ((12.87 / 16.01) – 1) = -20%.
Source : illinois.edu