Nitrogen rates ranged from 0–250 lbs ac-1 in 50 lb increments at the Beresford site and from 0–225 lbs ac-1 in 75 lb increments at the Brookings site.
PLANTING
Corn was planted in 30-in. rows at Beresford and 20-in. rows at Brookings at 31,000 corn seeds ac-1 and 130,000 soybean seeds ac-1. Corn was planted on 15 May in Beresford and 23 May in Brookings. Soybean was planted 23 May in Beresford and 14 June in Brookings.
Results
CORN YIELD
For the Beresford site, corn yield ranged from 142 to 235 bu ac-1 with a mean yield of 180 bu ac-1 across all treatments (Figure 3). The zero-N plots corn yield averaged 168 bu ac-1 regardless of cover crop treatment. The addition of N fertilizer (50–250 lbs ac-1) increased mean corn yield 7–33 bu ac-1 across the cover crop treatments. Overall, corn yield did not increase substantially with added N fertilizer as it would it most seasons. Therefore, we were not able to calculate an optimal N rate at this site. This lack of greater increase in corn yield with more N fertilizer applied may have been due to the high winds causing some stalk breakage during the growing season. In addition, within each N fertilizer rate there was no practical differences in corn yield among the three cover crop treatments.
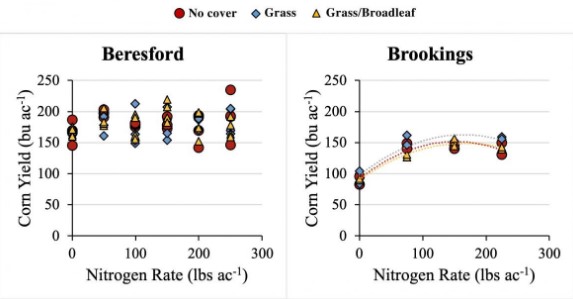
Figure 3. Corn yield response to N fertilizer for three cover crop treatments (no cover crop, annual rye grass alone, and a grass/broadleaf mixture) at Beresford and Brookings, S.D. in 2019.
For the Brookings site, corn yield ranged from 83 to 162 bu ac-1 with a mean yield of 132 bu ac-1 across all treatments (Figure 3). The zero-N plots corn yield averaged 92 bu ac-1 across cover crop treatments. The addition of N fertilizer (75–225 lbs ac-1) increased mean corn yield 49–66 bu ac-1 across the cover crop treatments. Corn yield plateaued near 75 lbs N ac-1 for all three cover crop treatments. Further, corn yields were similar among the three cover crop treatments within each N fertilizer rate.
SOYBEAN YIELD
Soybean yield ranged from 52 to 76 bu ac-1 with a mean yield of 66 bu ac-1 at Beresford and from 33 to 50 bu ac-1 with a mean yield of 40 bu ac-1 at Brookings across the cover crop treatments (Figure 4). At Beresford, the grass/broadleaf cover crop mixture compared to grass and no cover crop treatments resulted in a more variable effect on soybean yield. Although, when comparing the mean soybean yield of each cover crop treatment, there was only a 3 bu ac-1 difference (65 to 68 bu ac-1). At Brookings, mean soybean yield and variability were similar among the three cover crop treatments.
Figure 4. The influence of three cover crop mixtures on soybean yield at Beresford and Brookings, S.D. in 2019.*
* The box midline represents the median, the ‘x’ marks the mean, the upper and lower edges of the box represent the 25th to 75th percentiles, the whiskers represent the range, and points outside the range represent outlier points that are >1.5 times away from either end of the box.
Conclusions From First Year
These results from the first year of this study indicate that grass or grass/broadleaf cover crop mixtures can be interseeded into corn and soybean without reducing yield or affecting N fertilizer required to obtain optimal corn yield. As this study continues, we will determine whether the cumulative effects of planting cover crops over several years will influence corn and soybean yield or N fertilizer required to obtain optimal corn yield.
Source : sdstate.edu