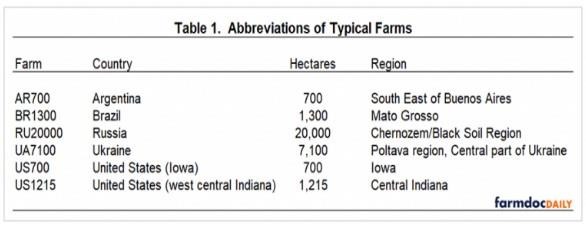
Corn Yields
Although yield is only a partial gauge of performance, it reflects the available production technology across farms. Average corn yield for the farms in 2015 to 2019 was 8.63 metric tons per hectare (137.5 bushels per acre). Average farm yields ranged from approximately 6.20 metric tons per hectare for the Brazilian farm (98.7 bushels per acre) to 12.64 metric tons per hectare for the Iowa farm (201.4 bushels per acre). Figure 1 illustrates average corn yield for each typical farm. Both of the U.S. farms had average corn yields above 11 metric tons per hectare (175 bushels per acre).
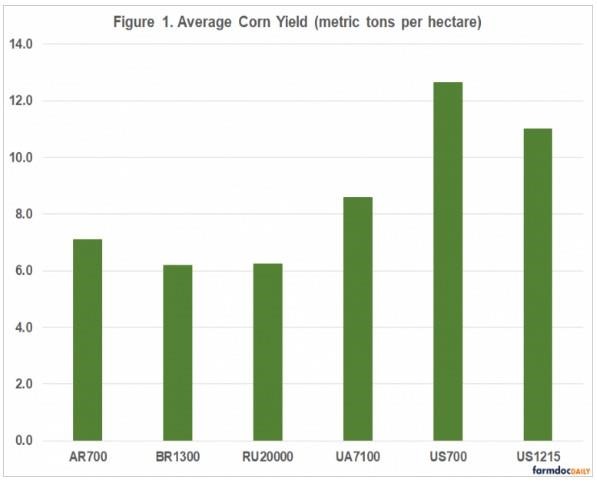
Input Cost Shares
Due to differences in technology adoption, input prices, fertility levels, efficiency of farm operators, trade policy restrictions, exchange rate effects, and labor and capital market constraints, input use varies across corn farms. Figure 2 presents the average input cost shares for each farm. Cost shares were broken down into three major categories: direct costs, operating costs, and overhead costs. Direct costs included seed, fertilizer, crop protection, crop insurance, and interest on these cost items. Operating cost included labor, machinery depreciation and interest, fuel, and repairs. Overhead cost included land, building depreciation and interest, property taxes, general insurance, and miscellaneous cost.
The average input cost shares were 41.2 percent for direct cost, 32.6 percent for operating cost, and 26.2 percent for overhead cost. The typical farms in Russia and in Iowa had below average cost shares for direct cost. All of the farms except the typical farm in Russia and the typical farm in Ukraine had below average cost shares for operating cost. Labor costs as a proportion of total costs were relatively higher for the typical farms in Russia and the Ukraine. Overhead costs as a proportion of total costs were relatively higher in Argentina and the United States. The relatively large cost share for overhead cost in the U.S. reflects our relatively high land cost.
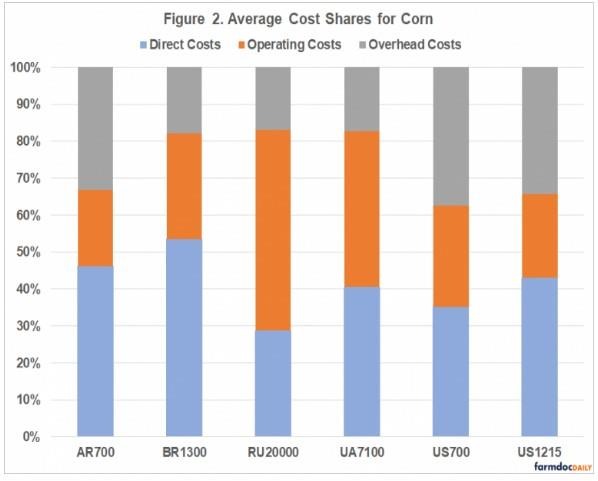
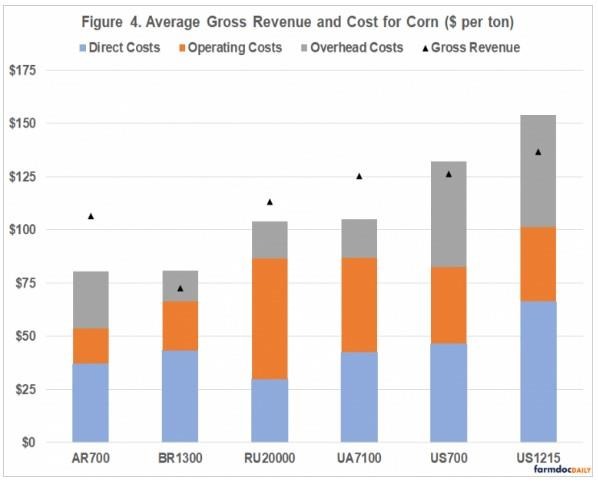
Revenue and Cost
Figure 3 presents average gross revenue and cost for each typical farm. Gross revenue and cost are reported as U.S. dollars per hectare. It is obvious from figure 3 that gross revenue per hectare is substantially higher for the two U.S. farms. However, cost is also substantially higher for these two farms. The typical farms from Argentina, Russia, and Ukraine exhibited economic profit during the five-year period. Average losses for the typical farms from Brazil, Iowa, and west central Indiana were $52, $41, and $191 per hectare, respectively, during the five-year period. The lowest economic profit during the five-year period for the typical farms was 2017 with an average loss of $125 per hectare. The lowest economic profit for each typical farm was as follows: 2015 for the typical farms in Argentina and Indiana, 2016 for the Iowa farm, and 2017 for the typical farms in Brazil, Russia, and the Ukraine.
Figure 4 presents average gross revenue and cost for corn on a per ton basis. Gross revenue per ton was relatively higher for the typical farm in the Ukraine and the two typical U.S. farms. However, the two U.S. typical farms also had relatively higher costs per ton. Economic profit for the five-year period was positive for the typical farms in Argentina, Russia, and the Ukraine.
Conclusions
This paper examined yield, gross revenue, and cost for farms in the agri benchmark network from Argentina, Brazil, Russia, the Ukraine, and the United States with corn enterprise data. Yield, gross revenue, and cost were substantially higher for the U.S. farms. The typical farms in Argentina, Russia, and Ukraine exhibited a positive average economic profit during the 2015 to 2019 period. The data for 2020 will be available early this fall. It will be interesting to see how the strong crop prices that occurred in the later part of 2020 will impact comparative results.
Source : illinois.edu