Grain Prices – The average price received for corn and soybeans by Illinois farmers comes for the NASS prices received survey which for major grains and oilseeds, is a panel of about 2,000 mills, elevators, and buyers in the main grain producing states. This survey is completed monthly asking the panel the total quantity purchased and total dollars received. The yearly number is the marketing year value for that crop year. Therefore, 2020 is not completed yet in this analysis but an estimate is used for the last three months based on the current World Agricultural Supply and Demand Estimates (WASDE) report.
Total Economic Costs – The total economic cost to produce corn and soybeans comes from FBFM cooperating farms. This cost not only includes cash costs, but also economic depreciation, unpaid labor cost and interest charges on non-land and land costs. Non-land interest charge is the economic cost of having grain inventory, prepaying inputs, and machinery ownership. Land interest charge is the economic cost of owning land.
Prices and Costs
Figure 1 shows the inflation adjusted average Illinois corn price received versus total economic costs to produce corn. The highest adjusted average price received for corn was $11.05 per bushel in 1974 while the lowest adjusted price received was $2.38 per bushel in 2005. This compares to the nominal high and low values of $6.87 per bushel in 2012 and $1.54 per bushel in 1986 respectively. It is interesting to note that a high year that we think of in the last ten years is 2012 which is the highest nominally in the period from 1972 to 2020, but that adjusted value is $6.87 per bushel (the same as real since 2012 is 100 in the index) which is the fifth highest in real terms.
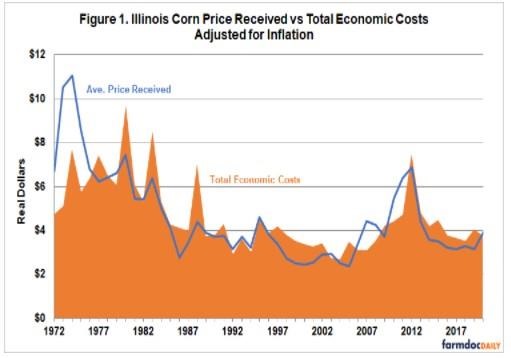
When looking at total economic costs to produce corn in Figure 1, the highest adjusted cost was $9.70 per bushel in 1980 while the lowest adjusted cost was $2.72 per bushel in 2004. The nominal high cost was $7.50 per bushel in 2012 while the nominal low was $1.12 per bushel in 1972. When comparing the differences in prices received and total economic costs, the early 1970’s was the period of highest economic returns per bushel while the period of the mid 1980’s was lowest period in real dollars.
The inflation adjusted average Illinois soybean price received versus total economic costs to produce soybeans is displayed in Figure 2. $23.76 per bushel in 1974 was the highest adjusted average price received and in 2001, $5.70 per bushel was the lowest adjusted average price received. This compares to the nominal high and low values of $14.60 per bushel in 2012 and $4.47 per bushel in 1972 respectively. 2012 is the high year most people think of in the last ten years for soybeans as it was for corn nominally, but it was only the 11th highest in real dollars for the average price received for soybeans.
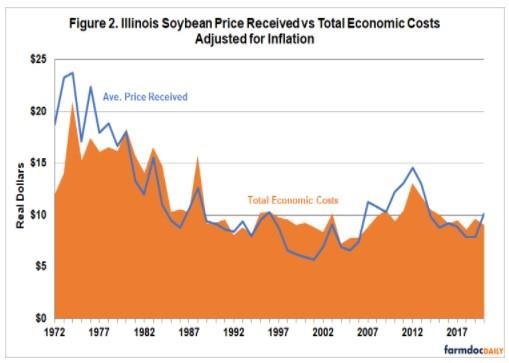
The highest adjusted total economic cost to produce soybeans in Figure 2 was $21.01 per bushel in 1974 and the lowest was $7.28 per bushel in 2004. When adjusted for inflation, the mid 1970’s was the period of highest economic returns while the early 1980’s and the late 1990’s/early 2000’s was the lowest periods of economic returns for soybeans.
Summary
When analyzing prices and returns in real dollars (adjusting for inflation), the higher prices we have seen in 2021 and in the not too distance past when the Renewable Fuels Standard (RFS) was increased by the passing of the Energy Independence and Security Act of 2007 are not as high when comparing to the 1970’s. When looking at total economic costs to produce corn and soybeans that have been adjusted for inflation, corn costs have had some peaks, but have been fairly level, especially since the mid 1980’s (outside of the high costs around 2012) while soybean economic costs have trended around $10.00 per bushel since the early 1980’s. So current prices are not as high as they were in the 1970’s but total economic costs are lower than they were in the 1970’s as well in terms of real dollars.
Source : illinois.edu