By Jonathan Coppess, Gary Schnitkey, Nick Paulson
Department of Agricultural and Consumer Economics
University of Illinois
and
Carl Zulauf
Department of Agricultural, Environmental and Development Economics
Ohio State University
The Agriculture Improvement Act of 2018 reauthorized the farm program decision for those farmers with base acres of covered commodities. The program decision is between Price Loss Coverage and Agriculture Risk Coverage, County Option on a crop-by-crop basis, or a farmer can elect Agriculture Risk Coverage, Individual Coverage option for all covered commodities on the farm. This article continues review of the 2018 Farm Bill by looking at the specific price-based assistance from the programs and how the farmer’s decision can be informed by recent price history (farmdoc daily,
February 21, 2019).
Background
For the decision between Price Loss Coverage (PLC) and Agriculture Risk Coverage, County Option (ARC-CO), the farmer chooses for each program crop with base acres individually and independent of the decision on other program crops. The decision will lock for the 2019 and 2020 crop years. Farmers will have a yearly option of revising the decision each of the next three crop years from 2021 to 2023.
PLC continues the fixed-price policy with statutory reference prices at the levels created in the 2014 Farm Bill: $3.70 per bushel; $8.40 for soybeans. The 2018 Farm Bill introduced an escalator provision for PLC that could increase the price protection above the statutory reference price. Specifically, PLC triggers payments whenever the marketing year average (MYA) price falls below the effective reference price. The effective reference price is the higher of the statutory reference price or 85% of the five-year Olympic moving average (5YOMA) of recent MYA prices; the effective price cannot, however, exceed 115% of the statutory reference price (e.g., $4.26 per bushel for corn). Recall that the five-year Olympic moving average of prices uses MYA prices for the previous five years, dropping the highest and lowest prices and averaging the remaining three prices.
As further background, Figure 1 provides a comparison of prices for corn using NASS Quick Stats. Specifically, Figure 1 illustrates the MYA for corn from 2003 through 2017 (green solid line), the fifteen years prior to the 2018 Farm Bill. For comparison, Figure 1 also illustrates the escalator, which is 85% of the 5YOMA price (light blue, dash and dot), for the 2008 through 2017 crop years. Finally, it includes the cap on the escalator provision (115% of the statutory $3.70 reference price or $4.26 per bushel). The comparison illustrates how a significant multi-year increase in the MYA impacts the escalator provision, which as discussed further below would increase the price calculation for PLC and ARC-CO, but that the Olympic moving average smooths down the peak MYA price. Also notable, the escalator cap would have impacted the prices used in the 2013 through 2015 crop years.
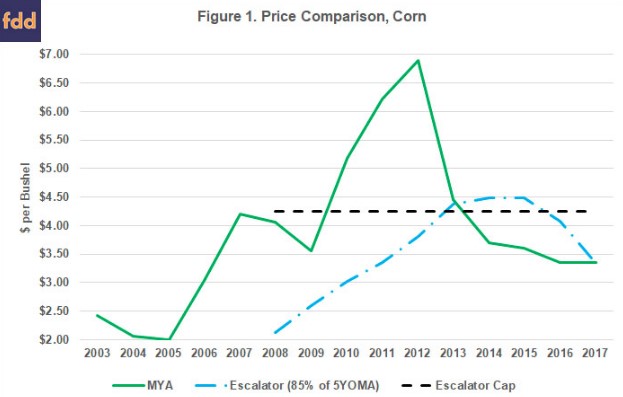
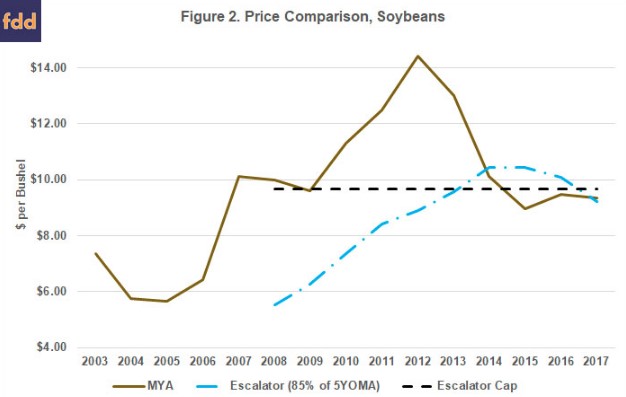
Figure 2 provides the same comparison for soybean prices from 2003 through 2017. The MYA from NASS Quick Stats is compared to the escalator (85% of the 5YOMA) and the cap (115% of the $8.40 statutory reference, or $9.66 per bushel). Again, this demonstrates how the Olympic moving average increases with an increasing MYA but smooths down the peak. Similar to corn, the cap for the escalator would have impacted the prices used in the 2014 through 2016 crop years of soybeans.
With the changes to PLC, both it and ARC-CO now incorporate this Olympic moving average feature. In review, ARC-CO calculates a benchmark revenue by multiplying the 5YOMA of national MYA prices and the 5YOMA of county average yields. The revenue guarantee is 86% of that benchmark; payments triggered when the actual year revenue (MYA multiplied by county average yield) is below the 86% guarantee, but the payment rate is not to exceed 10% of the benchmark. The 2018 Farm Bill, therefore, incorporated ARC-CO’s potential for adjusting to higher MYA prices into PLC through the use of the escalator and the effective reference price.
Discussion
The 10-year historical experience of prices provides a good example for farmers as they evaluate the changes to PLC with the escalator provision and effective reference price. In short, multiple years of significantly higher MYA prices will increase the price protection feature of the programs. Figure 3 illustrates the effective reference price for corn from the 2018 Farm Bill as against the MYA price scenario for the 2008 to 2017 crop years. Figure 3 applies the policy in the 2018 Farm Bill back against historic prices to demonstrate how it would have functioned had it been the policy in those years.
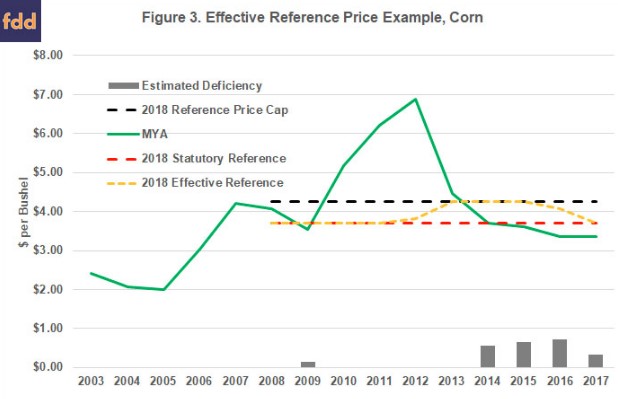
Figure 3 illustrates how the reference price escalator (85% of the 5YOMA)—had it been available—would have reacted to the historic multi-year price increase (2009 through 2012). Specifically, the escalator would have increased the effective reference price above the statutory reference price beginning in 2012 and reaching the cap for the 2013, 2014 and 2015 crop years. The effective reference price would have continued to be above the statutory reference price in 2016, providing higher payments. The estimated deficiency (effective reference price minus MYA) is also illustrated in Figure 3; a measure of expected payments under this policy where the MYA would have been below the effective reference price.
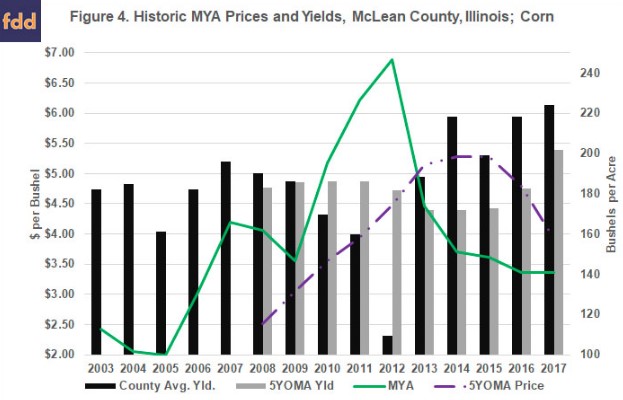
The PLC escalator provision incorporates an element of the ARC-CO policy with use of the 5YOMA price calculation. It alters the decision dynamic between the two programs. Figure 4 illustrates the price and yield movements for ARC-CO using the same historic MYA prices (2003 to 2017) and historic county average yields for McLean County, Illinois. For ARC-CO, the 5YOMA national MYA prices are multiplied by the 5YOMA county average yields to establish the benchmark revenue. For the benchmark, however, the reference price replaces any MYA below it; a provision that the 2018 Farm Bill revised to use the effective reference price as the plug for any MYA below it, as discussed further below.
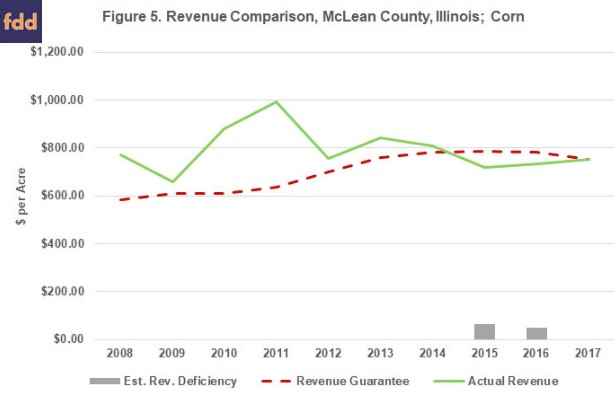
From these prices and yields, the ARC-CO revenue guarantee (86% of the benchmark) can be calculated and compared to the actual revenue in each historic crop year (2008 to 2017). Figure 5 compares the actual revenue to the revenue guarantee and an estimated deficiency when the actual was below the guarantee. The estimated deficiency would indicate payment expectations for the crop year from ARC-CO. Note that the revenue guarantee in Figure 5 was calculated using the 2018 provision that replaced the MYA with the effective price (higher of the statutory reference price and 85% of the 5YOMA MYA up to 115% of the statutory reference) in any year where the MYA was below the effective price. For McLean County, Illinois corn, use of the effective reference price as the plug in the benchmark calculation would have increased the guarantee for the 2016 crop year and increased the deficiency from $19.36 per acre to $48.39 per acre.
Based on historic prices and yields in Figures 3 through 5, the potential for payments based on estimated deficiencies under the 2018 versions of PLC and ARC-CO can be compared for McLean County, Illinois corn. Figure 6 illustrates that comparison, applying the 2018 programs to the 2008 to 2017 crop years. For PLC, Figure 6 does not use all changes to the programs from the 2018 Farm Bill. It uses the payment yields per acre (141 bushels per acre) by county for McLean County, Illinois, corn as reported by the Farm Service Agency (FSA, ARC/PLC Program Data) and not an updated yield. It also does not use the new trend yield provisions for the ARC-CO benchmark calculation. The estimated payments for PLC are the estimated deficiency if the effective price (escalator) had been in place, multiplied by the average program yield reported by FSA and 85% to represent the payment acres as percent of base acres. For ARC-CO, the estimated payments use the effective reference price plug as discussed above and are close to the actual payments as reported earlier for McLean County (farmdoc daily,
October 16, 2018;
October 6, 2017;
October 18, 2016). As in Figure 5, use of the effective reference price from the 2018 Farm Bill would have impacted payments for the 2016 crop year, increasing them from $17 per payment acre to an estimated $41.13 per payment acre.
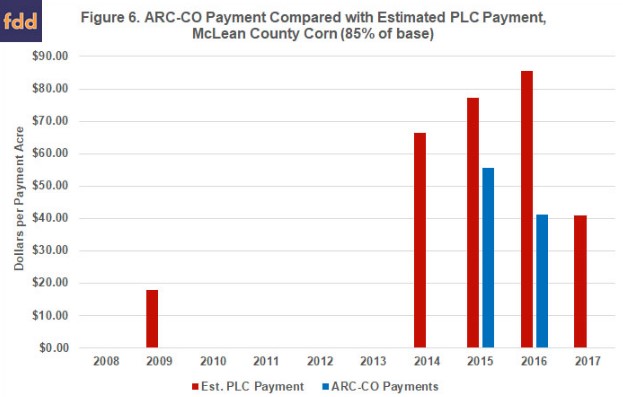
Figure 6 indicates that had the 2018 Farm Bill version of PLC—with the reference price escalator—been in operation during the 2008 through 2017 crop years, farmers with corn base in McLean County, Illinois would have received larger payments from PLC than ARC-CO. To complete this comparison, Figure 7 compares estimated payments for corn base in McLean County, Illinois under the 2014 Farm Bill version of PLC with the 2018 Farm Bill version of PLC with the price escalator.
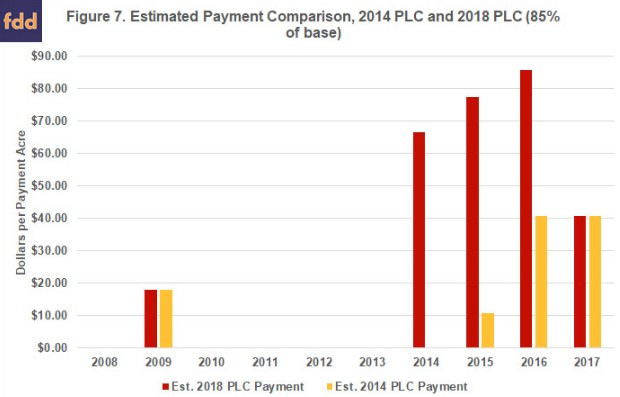
The PLC reference price escalator contained in the 2018 Farm Bill would have made a substantial difference in potential or estimated PLC payments had it been in place for the 2014, 2015 and 2016 crop years. Use of 85% of the 5-year Olympic moving average would have shifted the effective reference price above the statutory reference price, increasing the deficiency when actual MYA prices fell after 2012. That is, however, a backward-looking perspective only; given expected prices in the coming years, the escalator will not increase the effective reference price above the statutory reference price in 2019 or 2020. Thus, the effective reference price will not alter payments for either PLC or ARC-CO.
Concluding Thoughts
Under the 2018 Farm Bill, corn and soybean farmers will have the option of electing ARC-CO or PLC for their base acres of those crops for the 2019 and 2020 crop years. A key difference for this decision as compared to the 2014 Farm Bill program decision is that PLC now includes an escalator provision that could increase the effective reference price above the statutory reference prices ($3.70 per bushel, corn; $8.40 per bushel, soybeans) used to calculate the deficiency and payments. As will be discussed in upcoming articles, current price forecasts are low enough that the PLC escalator is not expected to increase the effective reference price above the statutory reference price for corn or soybeans. This article seeks to provide perspective on the change to the reference price by estimating the impacts if this escalator provision had been available during the 2008 to 2017 crop years. Because the escalator provision is unlikely to be effective in the coming years, looking at how it would have operated under historic prices is one method for evaluating the policy. In short, the escalator provision—had it been in operation—would likely have resulted in much larger payments than the 2014 Farm Bill version of PLC, as well as the 2014 Farm Bill version of ARC-CO. This provides one perspective for farmers in making the program decision for 2019 and 2020 under the 2018 Farm Bill. Future articles will evaluate the program decision under price forecasts and different scenarios for prices and yields.