Net Cash Storage Returns over Time
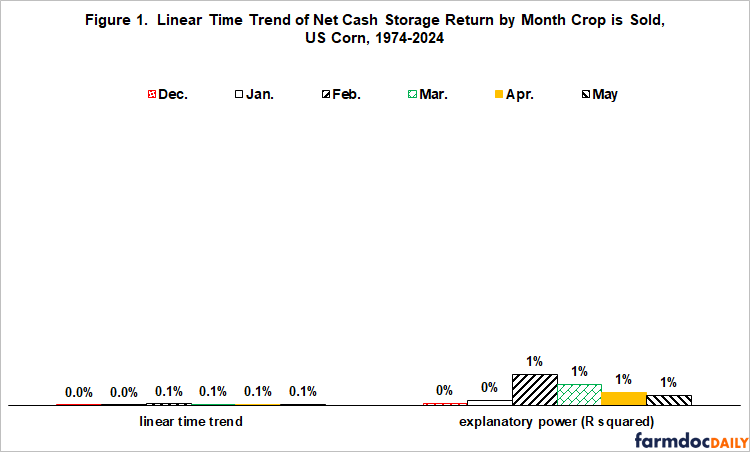
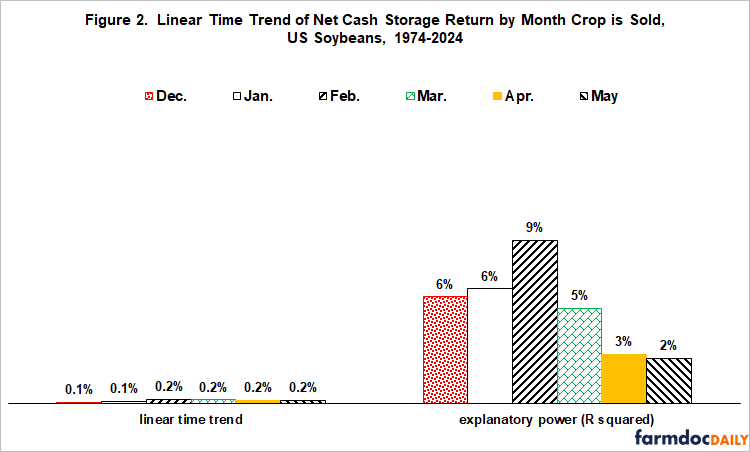
Linear time trend of net return to cash storage is positive for all corn and soybean storage periods (left side of Figures 1 and 2), suggesting returns to cash storage have trended up since 1974. Explanatory power of the time trend is however minimal, especially for corn (roughly 1%). For soybeans, highest explanatory power is 9% for October-February storage, implying the time trend explains 9% of year-to-year variation in soybean net cash storage return. Statistical significance exceeds 90% confidence but not 95% confidence for 3 soybean storage periods: October-December, October-January, and October-February. Both percentages are commonly used to assess statistical significance. For corn, statistical significance never exceeds 62% confidence for any storage period. Collectively, these results imply no downward trend in US corn and soybean net returns to cash storage since 1974.
Net Hedged Storage Returns over Time
The annual time trends of net returns to hedged storage are negative for all corn and soybean storage periods (left side of Figures 3 and 4), although close to zero for soybean storage to April and May. Explanatory power is low, but higher than for cash storage of corn and for cash storage of soybeans at shorter periods. For corn, statistical significance exceeds 95% confidence for all six storage periods and 99% confidence for October-January and October-February. For soybeans, statistical significance is less. Confidence exceeds 95% for October-December and 99% for October-January and October-February. Although mixed, these results do not statistically rule out a downward trend in net returns to hedged storage of corn and soybeans. Economic significance is likely because an annual time trend accumulates. Specifically, an annual trend of -0.1% becomes -1% over 10 years.
Source : illinois.edu