By Josh Maples
USDA-AMS reports the National Feeder and Stocker Cattle Summary each week. This series includes weekly receipts. Feeder and stocker receipts in this data series averaged 255,941 head during the first 8 months of 2025. This is 7.6 percent below the average for the same period in 2024 and 10 percent below the 2020-2023 average for January-August. These changes illustrate the tightening supplies of feeder and stocker cattle.
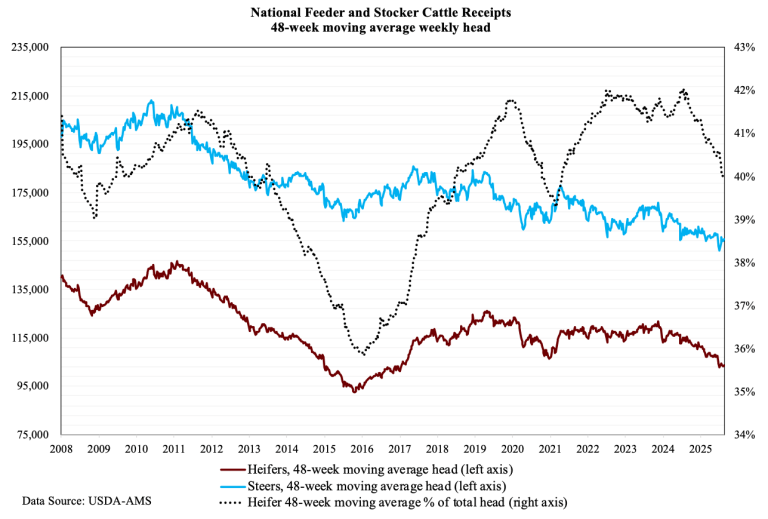
The chart above shows a different approach to analyze receipt patterns over time. The data are weekly; but instead of the current week’s total, the solid lines represent the weekly average for the prior 48 weeks. I used 48 weeks because this is usually the same as one year due to holiday weeks with no reports. For example, the most recent point on the chart (the week of August 22, 2025) represents the average weekly sales from September 2024 to August 2025. It is helpful to look at auction receipts in this context because it smooths the irregularity of sales from week to week to get a broader view. The dotted line on the chart follows the same 48-week moving average and shows the percentage of feeder and stocker cattle receipts that are heifers. If the dotted line goes up, a larger share of heifers are being sold.