Yield increases from P fertilization in relation to soil-test interpretations
Figure 1 shows the relationships between corn and soybean grain yield increases and soil-test P results by the Bray-1 or Mehlich-3 tests using the standard colorimetric measurement of extracted P as an example. These tests continue to be statistically equivalent except in highly calcareous soils where the Mehlich-3 (colorimetric or ICP) or Olsen tests should be used (see PM 1688).
Figure 1. Relationships between corn and soybean grain yield increases from P fertilization and soil-test P (Bray-1 or Mehlich-3 colorimetric) showing the interpretation categories. VL=very low, L=low, Opt=optimum, H=high, VH=very high.
The yield increases show the commonly seen variability in responses from field trials. For the Very Low category, increases range from about 10 to 100 bu/acre for corn and 3 to 30 bu/acre for soybean. For the Low category, yield increases were lower but still significant and most often positive. For the Optimum category, yield increases were small, variable, and most frequently positive. For the higher categories, however, yields responses were small and near zero.
Yield responses to K in relation to soil-test K interpretations
Figures 2 and 3 show relationships between corn (Figure 2) and soybean (Figure 3) grain yield increases and soil-test K using the dry and moist/slurry sample handling procedures for the ammonium-acetate and Mehlich-3 extractants (results are statistically equivalent).
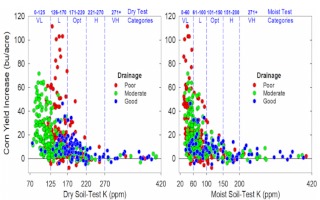
Figure. 2. Relationships between corn grain yield increases and soil-test K (ammonium-acetate or Mehlich-3) using the dry and moist sample handling procedures for three groups of soils with different drainage showing the interpretation categories. VL=very low, L=low, Opt=optimum, H=high, VH=very high.
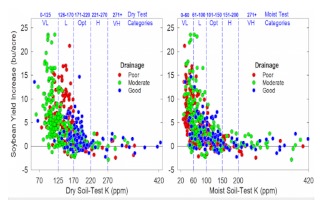
Figure. 3. Relationships between soybean grain yield increases and soil-test K (ammonium-acetate or Mehlich-3) using the dry and moist sample handling procedures for three groups of soils with different drainage showing the interpretation categories. VL=very low, L=low, Opt=optimum, H=high, VH=very high.
The relationships between yield increases and soil-test K levels show the usual very high variability in K field trials, which typically is greater than for P response trials. The graphs also show, with different symbol colors, results for soils with good, moderate and poor drainage. The distribution of the data points in the graphs for the dry and moist/slurry tests is remarkably different for both crops. Both Figs. 2 and 3 show an unexpected distribution of the data points for the dry K test for the Very Low, Low, and Optimum interpretation categories, since the highest yield increases are observed occurred for the test values in Low category and not in the Very Low category.
This problem for the dry K test has been observed and shown before, and is mainly due to its bad estimation of crop-availability of K in soils with moderately poor to very poor drainage. This anomaly is not observed in graphs for the moist/slurry test in both figures, in which the highest yield increases for both crops often were observed in the Very Low category. Both tests show that for the High and Very High categories yield responses are small, variable, and on average zero.
Economic benefits from fertilization in relation to soil-test interpretations
Figure 4 shows the relationship between net returns from P fertilization and soil-test P for three price scenarios. The fertilizer price used for the calculations was the prevailing price for DAP fertilizer in Iowa the first week of September ($730 per ton). The price per pound of P2O5 used for the calculations was adjusted to avoid considering the value of the nitrogen (N) in DAP. Figure 5 shows similar relationships for soil-test K using the dry or moist/slurry sample handling procedures for three scenarios. The K fertilizer price used for the calculations was the prevailing price for potash fertilizer (granulated potassium chloride) in Iowa the first week of September ($520 per ton). In both figures, the benefits for the three scenarios for each crop and nutrient reflect the different crop prices shown in the figures.
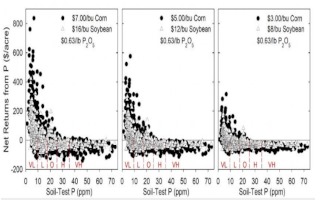
Figure 4. Net returns from P fertilization of corn and soybean for different soil-test P levels for three price scenarios showing the similar interpretation categories for the Bray-1 and Mehlich-3 colorimetric tests Very Low to Very High (VL, L, O, H, and VH).
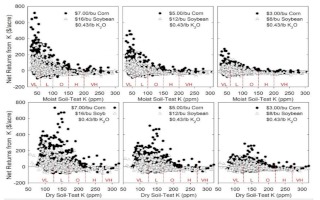
Figure 5. Net returns from K fertilization of corn and soybean for different soil-test K levels using the dry and moist/slurry sample handling procedures three price scenarios showing the soil-test interpretation categories for each procedure Very Low to Very High (VL, L, O, H, and VH), which are similar for the ammonium-acetate and Mehlich-3 extractants.
With soil P or K tests in the Very Low category, economic benefits from fertilization are very high and likely for all price scenarios. With soil tests in the Low category, benefits are lower but still likely and most often above the break-even line. Producers should not reduce recommended P or K application rates for low-testing soils, even on rented land, because the benefits from investing in fertilization are large and very likely. With soil tests in the Optimum category, the benefits of applying a removal-based rate are much smaller than for the Low category, but in most cases are still above break-even for the two best crop price scenarios (Figures 4 and 5). For tests in the High or Very High categories, however, in most cases the net returns to fertilization at or below the breakeven line for all price scenarios. This is the reason that only starter fertilization is suggested for the high-testing categories under specific conditions (see PM 1688).
The net returns to K fertilization in Figure 5 show that the moist/slurry sample handling procedure classify the net returns much better than the dry handling procedure. With the dry K test, it is very difficult to fine-tune K management, and this test is useful only to distinguish between soils testing very low with those testing in the high categories.
Fertilization rates for the Optimum category should be based on P and K removal from harvested plant parts using with prevailing yield levels for the field or sections of a field provided (not yield goal). These rates will maximize yield in most conditions, including fields with high-yield potential and maintain soil-test values. Producers should not over-react to one year lower or higher yield due to environmental conditions when estimating removal-based rates for soil-test maintenance. The suggestion in publication PM 1688 of using the “prevailing" yield levels means considering yield levels during the last 2 to 4 years, not a future yield or this year’s yield level. This is because research has shown that there is a good relationship between removal with harvest and P or K soil-test levels only over several years.
Source : iastate.edu