Net Revenues
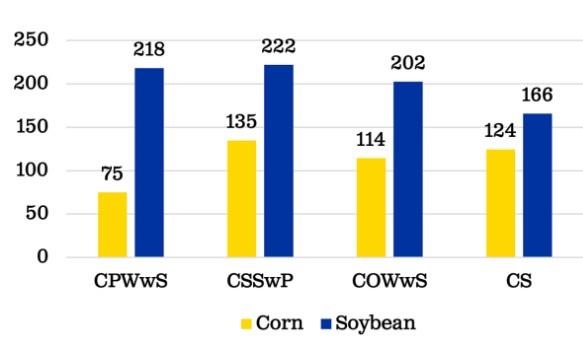
Net revenues of corn and soybeans in different crop rotations.
The synergy among the crops made a difference in corn yields for four different rotations. For instance, corn following pea had a greater yield than corn following soybean. Among all rotations, the CSSwP rotation had the highest corn yield.
As shown in Figure 1, net revenues for both corn and soybean in the CSSwP rotation ranked the highest among all rotations. While the two-year rotation has the second highest revenue for corn, it has the lowest revenue for soybeans. This is due to the lower soybean yield in the two-year CS rotation than those in the four-year diversified crop rotations.

Figure 1. Net revenue of corn and soybean in each rotation (Unit: $/acre).
Economic Performance
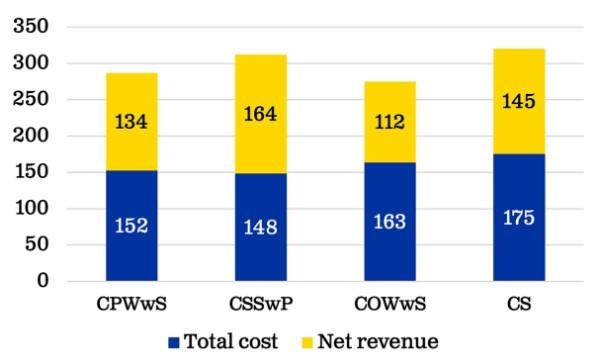
Overall economic performance of different crop rotations.
Figure 2 displays the total cost and net revenue for the three four-year rotations in comparison with the one two-year rotation, as averaged across the study period. The total production costs, including machinery operation, fertilizer, herbicide and seed, for the two-year CS rotation ranked the highest among all crop rotations. Specifically, the total cost for the CS rotation was 7%, 15%, and 18% greater than the COWwS, CPWwS and CSSwP respectively. Among the four-year rotations, the CSSwP rotation has the highest net revenue among all rotations, which surpasses the CS rotation in terms of reduced cost and increased net revenue. Other than CSSwP, the other crop rotation systems in our study are not as competitive as CS when it comes to net revenue comparison.

Figure 2. Net revenue and total production cost for each crop in four rotation (Unit: $/acre).
Summary
A comparison of the three four-year diverse crop rotations with the two-year CS rotation indicates that the right selection of crop rotation system plays an important role in optimize economic returns. The two-year CS rotation may achieve the highest economic returns with sufficient fertilizer input, yet this simplified rotation lacks resilience when N fertilizer is applied below the level for yield maximization goal, as demonstrated by declining economic returns over the study period.
In comparison, the CSSwP rotation is resilient to a reduced-N fertilizer application rate, with the lowest total cost and highest net revenue among all rotations. Our study suggests that extending the CS rotation to the more-diversified crop rotation, such as CSSwP, offers the potential to improve economic returns and reduce the overreliance on N fertilizer.
Source :