Figure 1. Drought conditions across Kansas on a) March 29, b) June 28 and c) September 27, 2022. Source: National Drought Mitigation Center.
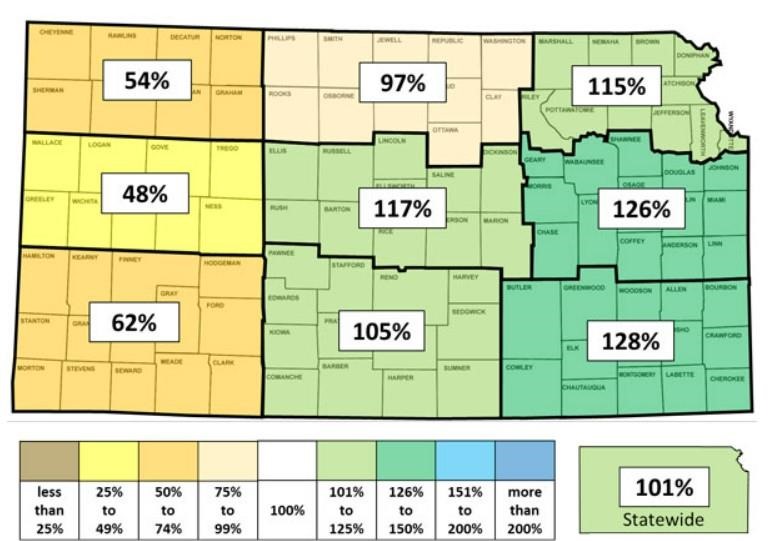
Figure 2. Percent of normal precipitation averaged by Kansas climate division, April 1-June 30, 2022.
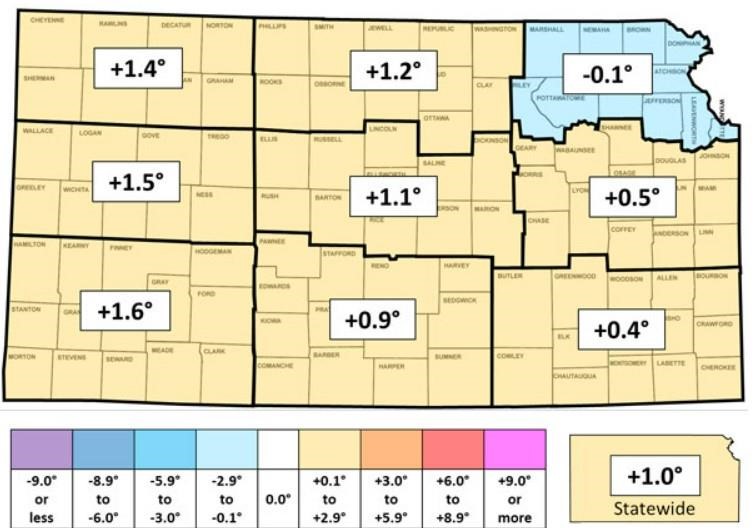
Figure 3. Departure from normal temperature averaged by climate division, April 1-June 30, 2022.
Summer 2022
The long, hot, dry summer kicked in, and all of Kansas was significantly affected. Below-normal precipitation was the rule statewide from July through September (Fig. 4); the state averaged only 60% of normal precipitation for this period. Above-normal temperatures accompanied the dry conditions (Fig. 5). As a result, drought conditions rapidly deteriorated (Fig. 1c). Parts of southeast Kansas went from being drought-free to D4 status in just three months. The third quarter of 2022 is the driest on record in southeast Kansas and the second driest on record in south central Kansas, dating back to 1895. Less than 2% of the state is currently drought-free. The DSCI more than doubled during this period (Fig. 6); the index was up to 326 as of September 27th. The last time the DSCI was 326 or higher was back in May 2014. Nearly 25% of the state is now in D4 status, and over half the state is in D3 or worse status. The last time both of these events happened was in 2013.
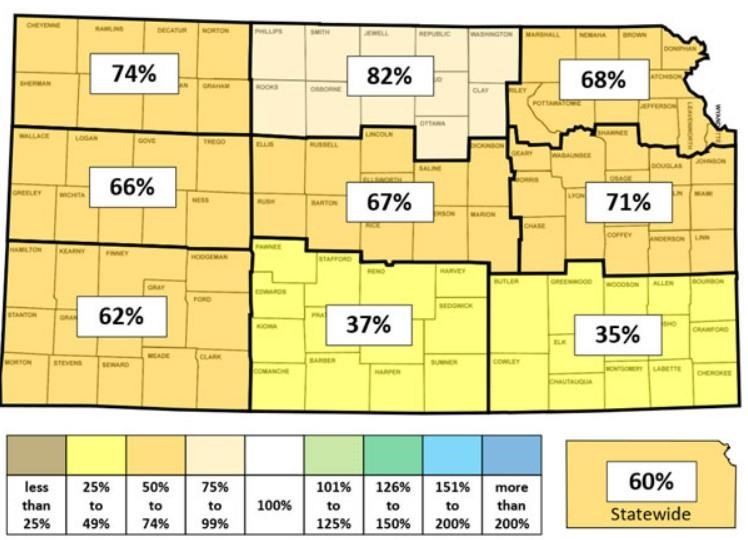
Figure 4. Percent of normal precipitation averaged by Kansas climate division, July 1-September 30, 2022.
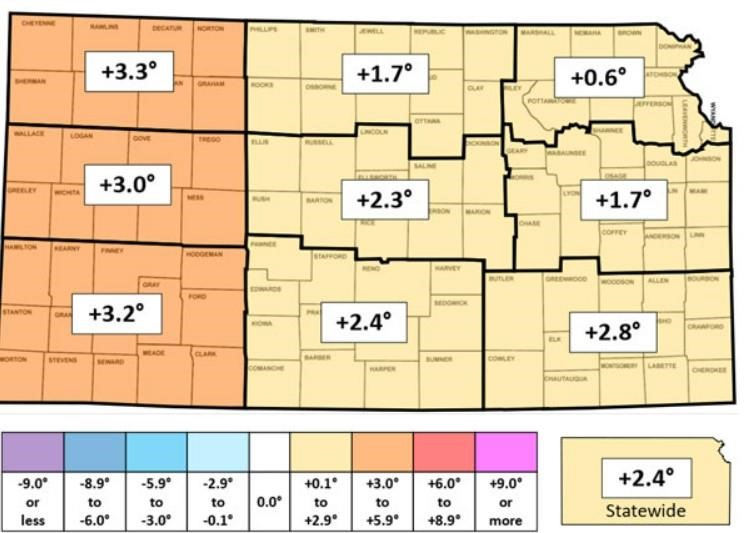
Figure 5. Departure from normal temperature averaged by climate division, July 1-September 30, 2022.
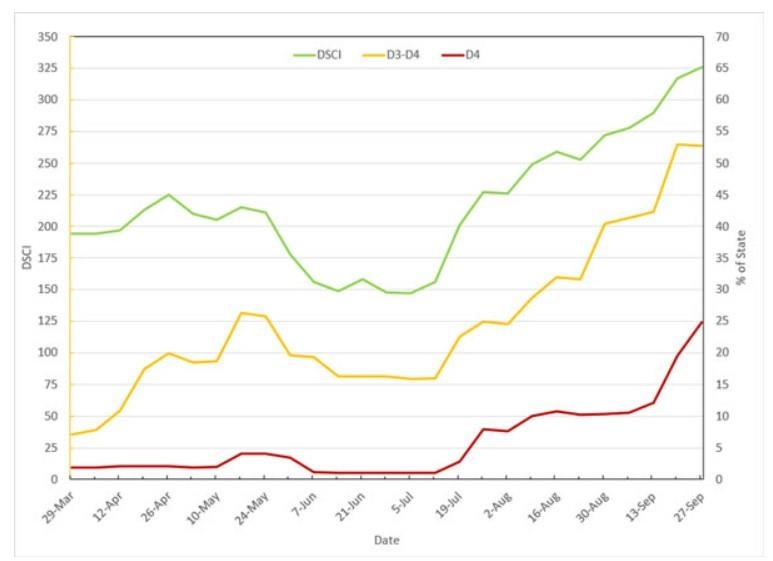
Figure 6. Drought Severity Coverage Index (DSCI) and the percent of Kansas in D3 and/or D4 status during the 2022 growing season.
A closer look at western Kansas
If we look only at the western third of Kansas, the high temperatures and lack of significant moisture are far more unusual than a once-in-a-decade event as suggested by the magnitude of the DSCI (Table 1). All three of the western climate divisions’ average temperature and total precipitation values rank in the top 12 of both the warmest and driest growing seasons on record, dating back to the start of archived climate divisional data in 1895.
This is Garden City’s driest growing season in 130 years of record keeping; only 4.86 inches of precipitation has been recorded as of September 30. This is 9.92 inches below normal, and 0.03 inches lower than the current record set in 1934, during the Dust Bowl era. Liberal (7.21”, departure -8.01”), Goodland (8.42”, -6.58”), Dodge City (9.69”, -7.96”) and Hill City (9.95”, -6.82”) have all had less than 10 inches of precipitation since April 1; these amounts rank between 11th and 16th driest at all four locations. Thanks to 101 days with highs of 90° F or more, one less than the record set in 2011, Dodge City’s average temperature since April 1 ranks as the 4th warmest out of 148 years of climate data. Other locations where the counts of 90°-days rank in the top 10 of most days on record include Wichita (94 days; ranks 4th out of 134 years), Concordia (78 days; 6th out of 138 years), and Hill City (89 days; 9th of 96 years). Ashland (Clark County) has the highest count of 90° days anywhere in Kansas: 112 days, which ranks as tied 3rd out of 123 years at that location. Of those 112, 43 of the days had highs of 100° or more, only 4 off the highest count in the state: 47, in Healy (Lane County).
Table 1. Average temperature and precipitation, departures from normal and rankings of the 2022 growing season (through September 30th) against the full period of record for climate divisional data (1895-2022). Departures are based on 30-year normals for the period 1991-2020.
#: Division | Average Temperature (Departure) | Rank - Warmest | Total Precipitation (Departure) | Rank - Driest |
1: Northwest | 68.6° (+1.7°) | 12th | 10.12” (-6.04”) | 7th |
4: West Central | 69.8° (+1.7°) | 10th | 8.77” (-6.66”) | 6th |
7: Southwest | 71.7° (+2.0°) | 10th | 9.18” (-5.69”) | 7th |
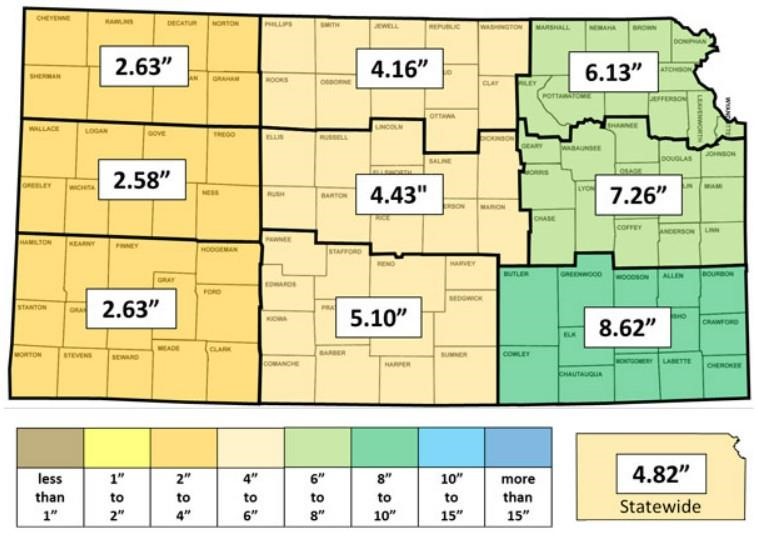
Figure 7. Average precipitation by climate division, October 1-December 31.
Looking ahead for fall and early winter
The problem with the fourth quarter of the year, climatologically speaking, is that normal precipitation is much lower than in summer (Fig. 7). The average precipitation in southwest Kansas, for example, is just 2.63 inches for the last three months of the year. Even if southwest Kansas averaged 8 inches of rain in the last three months of year (which has only happened once in 127 years: 8.04” in 1946), it would still not be enough to completely erase the precipitation deficit, since 8 inches would only be 5.37 inches above normal, and the current average deficit in southwest Kansas as of September 30 is 5.63 inches. It would take an unprecedented fourth quarter for southwest Kansas to finish the year at normal precipitation.
Source : ksu.edu