Action plan for improving dry matter intake efficiency
Goal – Monitor energy corrected milk, dry matter intake and feed efficiency on a monthly basis.
Step 1: Set a schedule for monitoring the dry matter percent of the TMR.
Step 2: Record refusals so the actual intake can be calculated per pen.
Step 3: Calculate energy corrected milk using the equation (12.82 * fat lbs.) + (7.13 * protein lbs.) + (0.323 * milk lbs.). (Use bulk tank milk pounds and components from milk check)
Step 4: If feed efficiency is consistently on the low end of the recommended range (<1.45), sample the TMR for analysis to check for accuracy. Examine ingredients being used for energy sources, i.e. corn silage, cereal grains, byproduct feeds.
Step 5: Check forage digestibility, feed (i.e. corn grain) particle size and ration particle size for possible issues impacting rate of passage.
Step 6: Work with a nutritionist on strategies to bring intake in line with production.
Economic perspective:
Monitoring must include an economic component to determine if a management strategy is working or not. For the lactating cows, income over feed cost is a good way to check that feed costs are in line for the level of milk production. Starting with July 2014’s milk price, income over feed cost was calculated using average intake and production for the last six years from the Penn State dairy herd. The ration contained 63% forage consisting of corn silage, haylage and hay. The concentrate portion included corn grain, candy meal, sugar, canola meal, roasted soybeans, Optigen and a mineral vitamin mix. All market prices were used.
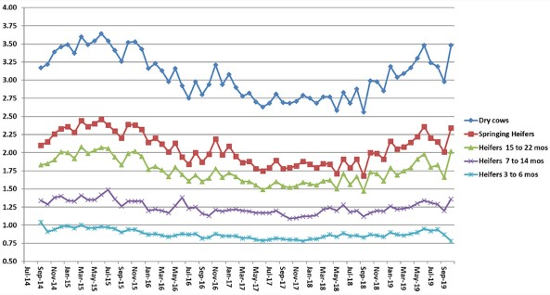
Also included are the feed costs for dry cows, springing heifers, pregnant heifers and growing heifers. The rations reflect what has been fed to these animal groups at the Penn State dairy herd. All market prices were used.
Income over feed cost using standardized rations and production data from the Penn State dairy herd.
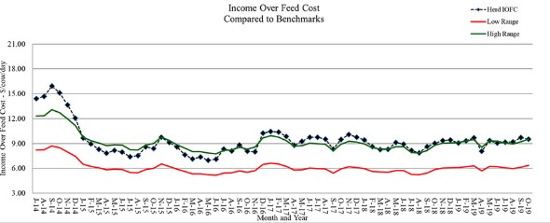
Note: October’s Penn State milk price: $19.60/cwt; feed cost/cow: $6.37; average milk production: 81 lbs.
Feed cost/non-lactating animal/day.
Source: psu.edu