For 2019, the loss ratio for corn was 1.06, above the 2002-2019 average of .78 and above the ten-year average of .89 (see Table 1). Wet weather caused corn’s loss ratio to be higher than in recent years, but the loss ratio is not particularly high. It would appear that droughts have much more impact on losses than does wet weather. The highest loss ratio for corn occurred in the 2012 drought year and was 2.74. Even given the 2012 drought year and 2019 prevent plant year, the ten-year and the longer-term average corn loss ratios are below the 1.00 benchmark.
Soybean’s loss ratio in 2019 was 1.05. Loss ratios on soybeans have been low in recent years, with an average of .62 for the 2002-1019 period, and .56 for the last ten years. The last time a soybean loss ratio exceeded 1.00 was in 2003 when the loss ratio was 1.45.
In 2019, wheat had a .85 loss ratio, slightly higher than the ten-year average loss ratio of .79. Cotton had a 1.14 loss ratio in 2018, above the 1.06 average for the last ten years. Peanuts had a 2.92 loss ratio, well above the 1.64 ten-year average. For cotton and peanuts, average loss ratios for 2002-2019 and for 2010-2019 exceed 1.00, unlike the averages for corn, soybeans, and wheat.
Regional Differences in Loss Ratios
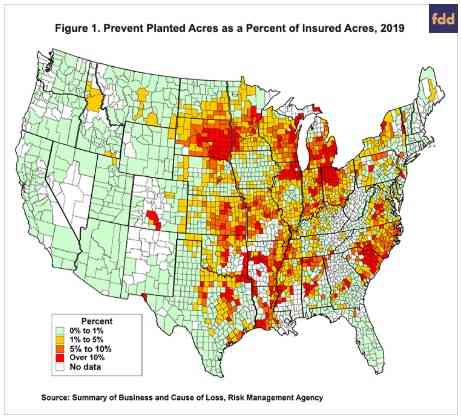
As is typical, loss ratios varied widely across the United States, and wet weather and prevented planting were positively correlated with higher losses. Prevented planting payments represented 34% of total payments for corn and 30% of total payments for soybeans in 2019. Those areas with large amounts of prevented planting also had claims from yield and revenue losses, likely because wet weather caused late planting, which reduced yields on farmland that was planted. Late and prevented planting was prevalent along the South Dakota/Minnesota border, Wisconsin, northern and southern Illinois, northern and central Indiana, Ohio, northwest and north-central Ohio, and central and southern Michigan (see Figure 1).
Counties with more than 10% of their acres in prevented planting typically had loss ratios above 1.5 (see Figure 2). On the other hand, areas without as much wet weather usually had lower loss ratios. For example, prevented planting was not as pronounced in Iowa as in other parts of the Midwest. Except for some counties along the northwest border, Iowa counties had loss ratios below 1.0, with many northern and central counties having loss ratios below .5.
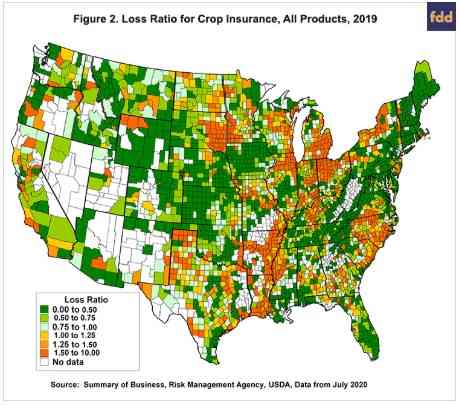
Illinois had a mixed performance. Loss ratios were well above 1.0 in northern and southern Illinois, where a great deal of prevented planting existed. Counties with the highest loss ratios were Cook (4.48), Lake (3.58), Will (3.37), Bureau (2.97), and De Kalb (2.75). On the other hand, many counties in central Illinois had little prevented plant and low loss ratios. Counties with the lowest loss ratios were Douglas (.07), Piatt (.08), De Witt (.13), Edgar (.15), and Logan (.16). Over the entire state, the average loss ratio in Illinois was 1.05 for corn and 1.00 for soybeans.
Loss Performance by Product in Illinois
Unlike area plans, the COMBO product makes payments on farm revenue or yields and has provisions for making prevented planting payments. As a result of prevented planting provisions, the COMBO products had higher loss ratios for corn than did the plans using county guarantees to determine payments (see Table 2). COMBO products include Revenue Protection (RP) with a 1.14 loss ratio, RP with harvest price exclusion (RPHPE) with a 1.74 loss ratio, and Yield Protection (YP) with a 2.02 loss ratio.
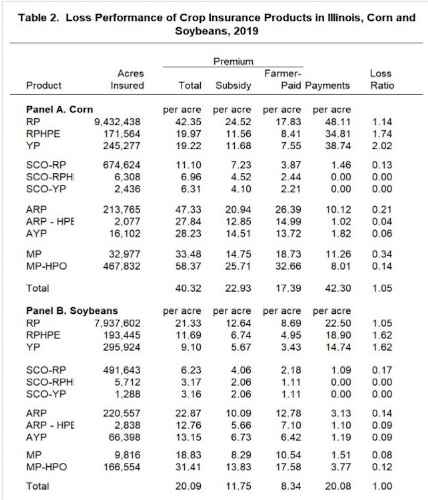
Supplemental Coverage Option (SCO) with RP as the underlying product had a .13 loss ratio for corn (see farmdoc daily, March 12, 2019). This product was used on 674,624 acres in Illinois. The 2019 projected price for corn was $4.00 per bushel and the $3.90 harvest price was 97.5% of the projected price. For SCO to make payments on its 86% county guarantee, yields would have to fall below expected yields by 11.5%. Most counties did not have this fall in yields.
Area Risk Plan (ARP) is the largest plan sold in the Area Risk Protection Insurance (ARPI) policy, which are stand-alone county-level products. ARP had a loss ratio of .21. Most individuals purchase ARP at the 90% coverage level. Given the projected and harvest prices in 2019, county yields would have had to fall from guarantee levels, which did not happen in most counties where ARP was purchased.
Margin Protection (MP) was offered in Illinois for the first time in 2019, and MP with the Harvest Price Option (MP-HPO) was used on 467,832 acres (see farmdoc daily, September 8, 2017). Similar to SCO and ARP, MP-HPO had a very low loss ratio of .14.
COMBO Products for soybeans had loss rates of 1.05 for RP, 1.62 for RPHPE, and 1.62 for YP. The projected price for soybeans was $9.54 per bushel, and the harvest price of $9.25 per bushel was 97% of the projected price. For the area plans, soybean yields had to be below the guarantee to trigger payments. In general, yields were near trends, resulting in low payments and low loss ratios on SCO, ARP, and MP for soybeans.
Summary
Weather across much of the Midwest was highly unusual in 2019, resulting in much delayed and prevented planting. As a result, crop insurance payments were higher than usual, causing payments to roughly equal total premiums. Although the Midwest had considerable areas of prevented planting, some parts did not, resulting in lower total crop insurance payments than if prevented planting had been more prevalent across all the Midwest.
Source : illinois.edu