Coverage levels have a pronounced geographical distribution. To illustrate, the average coverage levels were calculated for Revenue Protection (RP) corn policies offered through the Risk Management Agency in 2020. A county’s average coverage level represents the average of all RP policies’ coverage levels weighted by acres insured. In 2020, corn policies in Champaign County, Illinois, had an average coverage level of 82%, resulting from 62% of the acres being insured with 85% coverage level, 29% of acres being insured with 80% coverage level, 6% with 75% coverage level, and 3% of the acres being insured with lower coverage levels (Summary of Business, RMA).
Figure 1 shows average RP coverage levels for corn policies in 2020. Only RP policies are shown because RP represents over 90% of the Federal crop insurance policies sold in 2020 (farmdoc daily, November 17, 2020). In Figure 1, counties shaded in green have average coverage levels over 80%. Most of these counties are in a band from southern Minnesota through northern and central Iowa, Illinois, and Indiana, extending into western Ohio. This area generally is regarded as the heart of the Corn Belt.
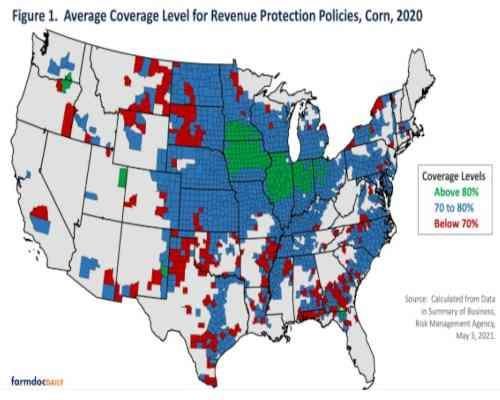
In Figure 1, counties shaded in blue have average coverage levels between 70% and 80%. Most counties in the Midwest outside the heart of the Corn Belt have average coverage levels in this range. Moreover, most major production areas outside the Midwest also have average coverage levels between 70% and 80%, including counties in the Eastern Seaboard, South, Delta, and much of the Great Plains.
Scattered counties with red shading in Figure 1 have loss ratios below 70%, generally in areas that have high risk.
Coverage Levels and Premiums
In general, counties with the highest average coverage levels tend to be in areas that have lower production risks. For example, the heart of the Corn Belt has good weather and favorable soils, causing these areas to have lower production risks relative to areas outside the central corn belt. In central Illinois and Indiana, the major production risk is a chance of drought, which from a historical perspective happens less than 1 in 20 years. Iowa and southern Minnesota’s risks are less from droughts and more from wet weather and delayed planting. In all areas in the heart of the Corn Belt, production risks are relatively low.
As a result of lower production risks, central Corn Belt counties have lower premiums than areas outside the heart of the Corn Belt. Insuring at high coverage levels costs less than in the heart of the Corn Belt than in areas outside this region.
ECO
The Enhanced Coverage Option (ECO) was a product first available in 2021. One suspects that most of the sales of this product happened in areas where average coverage levels were the highest. In these high coverage areas, many farmers use the highest coverage level of 85%. Polices such as ECO may present farmers with opportunities to insure at higher levels at what many regard as reasonable costs.
At this point, finalized values for acres insured with RP and ECO are not available; however, policies sold will give a good indication of farmer behavior. Polices sold for RP, and ECO with RP, on corn acres were collected from RMA’s Summary of Business on May 3, 2021. ECO policies are summarized by counties grouped on 2020 average coverage levels for RP. The same breakdowns as shown in Figure 1 are used:
- Counties with less than 70% average coverage levels represent 1,971,341 acres of RP coverage on corn in 2020 or 2.6% of acres insured with RP.
- Counties with average coverage levels between 70% and 80% represent 50,368,742 acres of RP coverage on corn in 2020 or 65.4% of acres insured with RP.
- Counties with over 80% average coverage levels represent 24,685,231 acres of RP coverage on corn in 2020 or 32.0% of acres insured with RP.
Policies sold for corn by these three categories and totals are shown in Table 1. Overall, 482,060 RP policies are reported as sold for 2021, with 12,131 of these policies having the ECO policy attached to those RP policies. Overall, 2.5% of the RP policies have ECO policies associated with them. Of these ECO policies, 86% were at the 95% coverage level, while the remaining 14% were at a 90% coverage level.
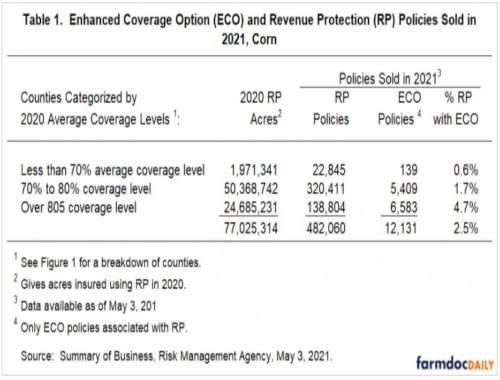
Counties with average coverage levels over 80% had 4.7% of their RP policies with an ECO attached to them, about twice as high as the overall average. The percentage declines to 1.7% for counties with average coverage levels between 70% and 80% in 2020. The percentage of RP policies with ECO fell to 0.6% in counties with average coverage levels less than 70%.
Summary
Overall, 2.5% of RP policies used the ECO option in 2021. As expected, more ECO policies were purchased in counties where RP coverage levels were higher, generally in the heart of the Corn Belt. ECO was used at relatively high coverage levels as well, with 86% sold with the 95% coverage level, the highest available coverage level.
Source : illinois.edu