Charts 3 and Chart 4 consider grain farms exclusively and as such is a subset of the data used in the first two charts. Charts 3 and 4 use data from only 2019. Further, these two charts segment the three classes of liabilities into six age groups.
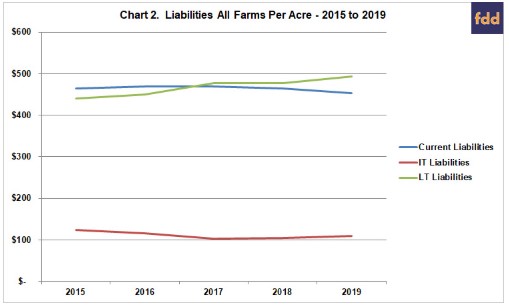
Chart 3 tells of liabilities increasing as operator age increases from under age 30 to about age 50 before decreasing. Current liabilities increased at the largest rate to about age 50 while intermediate liabilities decreased the fastest percent as age increased over age 50. Chart 3 also shows how the absolute dollar amount of borrowed capital varies with age (follows the business life cycle). There is a greater capital need as young people grow their operation and it maxes out in the 50’s age group. At this stage the growth phase slows and the profits of the farm are now used to pay down additional debt as well as supply additional operating funds thus lowering the need for borrowed capital. As noted in Chart 1, the dollar level of intermediate term liabilities is far less than that of current or long-term liabilities.
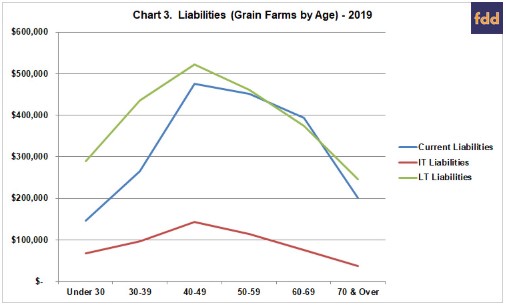
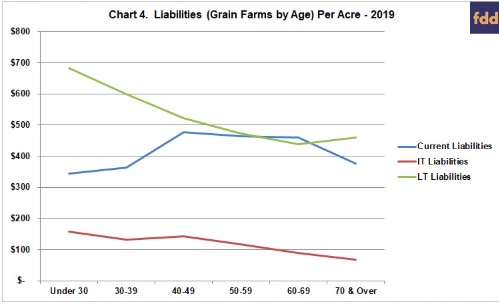
Chart 4 divides the three classes of liabilities by the number of operator acres and also segments the data into six age groups. The number of operator acres in each of the age groups are: Under 30 – 424 operator acres, Age 30 to 39 – 729 operator acres, Age 40 to 49 – 1,000 operator acres, Age 50 to 59 – 975 operator acres, Age 60 to 69 – 857 operator acres, and Over Age 70 – 535 operator acres. Current liabilities increase from the Under Age 30 group into the Age 40-49 group and remain flat prior to decreasing into the Over Age 70 group. Average intermediate term liabilities per operator acre is the highest during the Under 30 group and gradual decreases as the age groups increase. Average long-term liabilities are at their highest levels at the Under 30 group and decrease significantly into the Age 60-69 group where they tick up into the Over Age 70 group due to much faster decrease of operator acres.
Summary. We have noted in the Illinois FBFM data a long term trend of the average funds borrowed being larger than the average principal paid. In only one of the past twenty years has the opposite been true. This may be supported by the consolidation of farm operations in Illinois resulting in an increasing number of acres operated. An increasing number of acres operated points to a naturally increasing amount of current liabilities for those making use of borrowed capital for their operating needs. In addition, the greater variability in agriculture has led to tighter margins and the greater need for borrowed capital to meet cash flow requirements. The trend to a larger share of rented acres being cash rented would add to the increased need for borrowed capital to operate.
Source : illinois.edu