Economic cost is not cash cost that is used in most calculations of returns. However, economic cost are important and in the long run are arguably more important than cash cost. All input cost need to be covered in the long run, not just cash cost. Otherwise use of the input will decline or the input will leave the sector. It can be argued that economic net return provides a more complete and accurate measure of the underlying economic health of a sector, in this case crop agriculture.
Four government programs will make payments to farmers for 2024 crops. Two are ad hoc: ECAP (Emergency Commodity Assistance Program) and SDRP (Supplemental Disaster Relief Program), both authorized in December 2024. Two are standing, (i.e. on-going): crop insurance and commodity programs. Insurance payments are indemnities paid to farmers net of the premiums that farmers paid. They are calculated using USDA, RMA (Risk Management Agency) data. USDA, FSA (Farm Service Agency) reports payments by the other three programs. ECAP and crop insurance payments are largely complete for 2024 crops. Payments by the ARC-CO (Agriculture Risk Coverage – County) and PLC (Price Loss Coverage) commodity programs and especially by the SDRP ad hoc program are not complete and require estimates discussed in the Data Note.
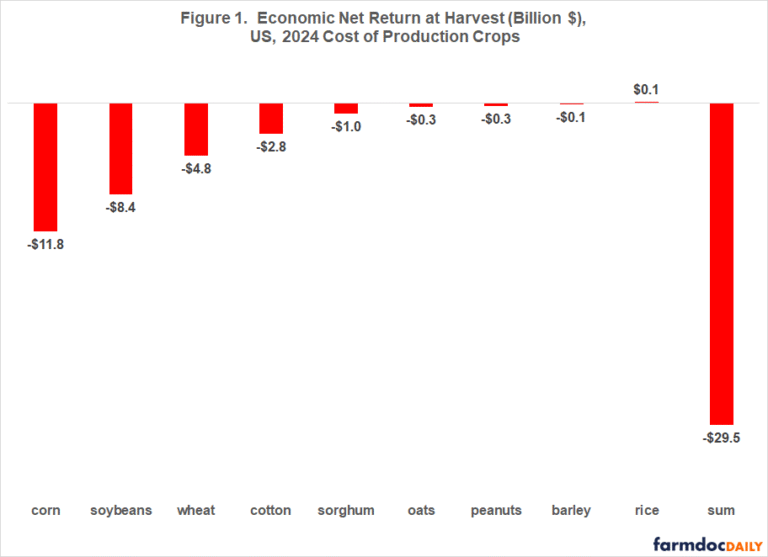
2024 Economic Loss at Harvest
Collectively, the cost of production crops had economic losses of nearly $30 billion at 2024 harvest (see Figure 1). Economic losses were largest for corn and soybeans at $11.8 and $8.4 billion. They reflect economic losses of $130 and $96 per planted acre across 91 and 87 million planted acres, respectively. Economic losses for wheat and cotton of $4.8 and $2.8 billion reflect per acre economic losses of $104 and $251 over 46 and 11 million acres. These four crops account for 91% of all economic losses at 2024 harvest by the nine cost-of-production crops.
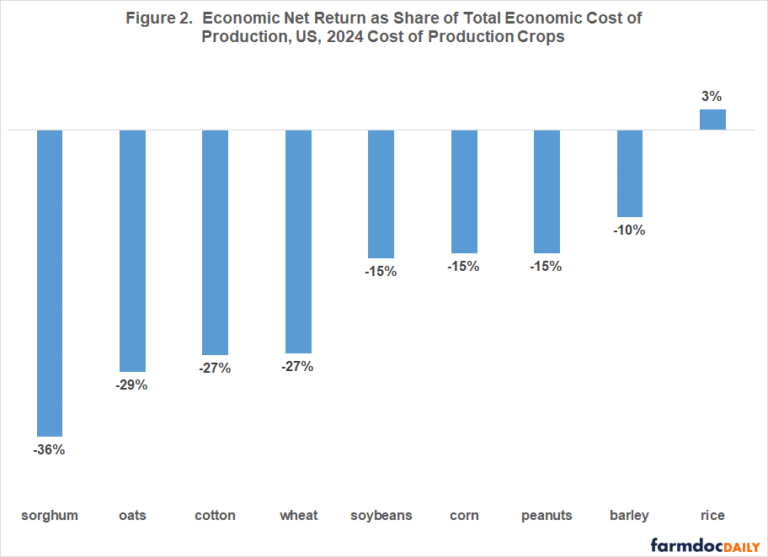
Because planted acres and economic cost of production per planted acre vary considerably across the cost-of-production crops, net economic return is also computed relative to economic cost of production. This ratio can be thought of as an economic profit (loss) margin per acre relative to economic cost of production. By this metric, 2024 harvest economic loss was highest for sorghum (36%) (see Figure 2). Corn and soybean economic loss was 15% while cotton and wheat economic loss was 27%. Rice returns covered total economic cost.
2024 Crop Safety Net Assistance by Program
As of early October 2025, collective government assistance to the cost of production crops is estimated at nearly $24 (see Figure 3). Ad hoc programs account for 65% of total assistance, with ECAP providing the most assistance. Smallest assistance is from ARC plus PLC commodity programs.
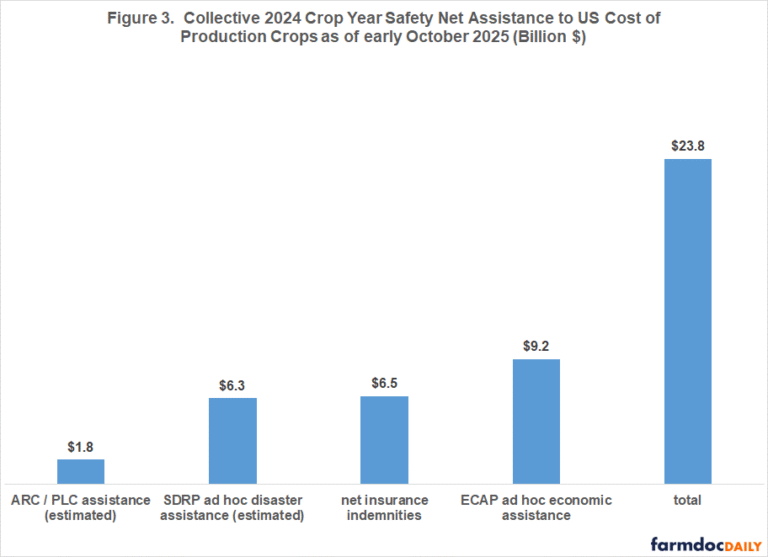
Total crop safety net assistance covers 80.6% of the $29.5 billion in collective economic loss at 2024 harvest for the nine cost of production crops, reducing collective economic loss to $5.7 billion. As a share of total economic cost of production, collective economic loss has declined from 16.8% to 3.3%.
Source : illinois.edu