By Gary Schnitkey
Department of Agricultural and Consumer Economics
University of Illinois
The 2019 projected prices for setting crop insurance guarantees in Midwest states are $4.00 per bushel for corn and $9.54 per bushel for soybeans. In this article, revenue guarantees are calculated for Revenue Projection (RP) policies with adjustments to reflect the basis between futures and cash prices. The resulting per acre cash revenue guarantees are below total costs given that farmland is rented at average cash rent levels. Even at high coverage levels, large losses will occur before crop insurance makes payments in 2019.
Insurance and Cash Revenue Guarantees
Revenue Projection (RP) is a crop insurance product used to insure over 90% of the insured acres in Illinois (farmdoc daily,
January 4, 2017). RP is a revenue product with a minimum revenue guarantee equal to:
coverage level x TA-APH yield x projected price
where
- coverage level is a selection made by the farmer,
- TA-APH yield is the Trend-Adjusted Actual Projection History yield. The TA-APH yield typically is the average of the ten most recent yields, adjusted for trend.
- Projected price is the average of settlement prices of Chicago Mercantile Exchange (CME) contracts during February.
This minimum guarantee will increase if the harvest price is above the projected price, in which case the harvest price replaces the projected price in revenue guarantee calculation. The harvest price is the average of settlement prices in October. The increase over the minimum guarantee is capped at two times the projected price.
The RP policy will make payments when harvest revenue is below the guarantee. Harvest revenue equals actual yields times harvest price. Payments equal the revenue guarantee minus harvest revenue.
The RP guarantee and harvest revenue are calculated using futures prices. Farmers typically receive less than the futures price when they sell grain. The difference between the cash price and the futures price is the basis. In central Illinois, basis typically is around -$.30 for corn and soybeans, with the basis on soybeans widening to over -$.40 since the trade dispute with China. Other areas will have wider basis. To more closely reflect the fact that farmers do not receive futures prices, the revenue guarantees are adjusted for basis in the next section to arrive at “cash revenue guarantees.” If the basis does not change, the cash revenue guarantee will reflect the cash revenue protected by the RP product. In the next section, farmer-paid premiums also are subtracted to show the difference in the protection offered by differing coverage levels.
Per Acre Cash Revenue Guarantees
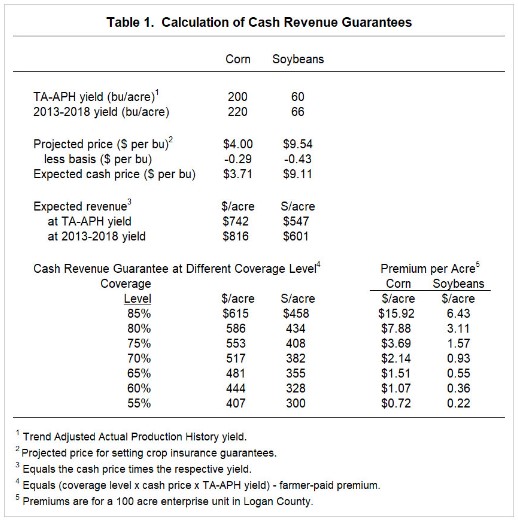
Table 1 shows the calculation of cash revenue guarantees for a typical situation in central Illinois having high-productivity farmland. This farm has a TA-APH of 200 bushels per acre for corn and 60 bushels per acre (farmdoc daily,
December 11, 2018 and
January 3, 2019). From 2013 to 2018, yields in Illinois have been above trend yields by 20 bushels per acre for corn and 6 bushels per acre for soybeans. For the central Illinois farm, this results in average 2013-2018 yields of 220 bushels per acre for corn and 66 bushels per acre for soybeans. Expected revenue is calculated using both the TA-APH yields and 2013-2018 yields. The expected revenues derived using TA-APH yields will be lower than the average 2013-2018 due to exceptional yields across Illinois.

For 2019, projected prices equal to $4.00 per bushel for corn and $9.54 per bushel for soybeans. Basis in central Illinois has been -$.29 per bushel for corn and -$.43 per bushel for soybeans, resulting in expected cash prices of $3.71 per bushel for corn and $9.11 per bushel for soybeans (see Table 1)
Expected revenues give estimates of most likely revenues for the upcoming year. Expected revenues using TA-APH yields are $742 for corn (200 yield x $3.71 expected cash price) and $547 for soybeans. Because yields have been above trend in recent years, TA-APH yields could be viewed as conservative expected yields. The 2013-2018 yields result in expected revenues for $816 per acre for corn and $601 per acre for soybean. Use of the previous five-year average yields have additional revenue of $74 for corn and $55 per acre for soybeans.
Cash revenue guarantees are shown in Table 1. At an 85% coverage level, for example, corn has an expected cash revenue of $615 per acre:
(.85 x 200 TA-APH yield x $3.71 expected cash price) – $15.91 premium.
This revenue guarantee based on the projected price is $680 per acre:
.85 x 200 TA-APH yield x $4.00 projected price.
The per acre cash revenue guarantee is $65 below the revenue guarantee.
Commentary
For corn, average non-land costs without insurance premiums are $560 per acre. Cash rented farmland at a $260 per acre rent has total costs of $820 per acre. Per acre costs of $820 are above the $816 expected revenue by $4 per acre. The cash guarantee at the 85% coverage level of $615 per acre is $205 per acre lower than total costs. A $205 loss would significantly weaken the financial position of most farms. Losses could be more substantial if lower coverage levels are selected.
For soybeans, average non-land costs without insurance premium are $350 per acre. Total costs with a $260 cash rent are $610 per acre. The cash revenue guarantee at the 85% coverage level is $458 per acre, $152 per acre lower than total costs. Significant weakening of the financial position occurs if crop insurance makes payments
Crop insurance provides essential protection to farmers. Still, significant losses will occur on most farms in 2019 if crop insurance is making payments.