By Gary Schnitkey
Department of Agricultural and Consumer Economics
University of Illinois
Since 2012, many areas in the greater Midwest had county corn and soybean yields that have exceeded trend yields by a large margin. These areas include much of Illinois, southern Wisconsin, eastern Nebraska, Kentucky, southern Indiana, and southern Ohio. On the other hand, other areas have yield averages near trends. These areas include much of northern and central Iowa, Minnesota, and eastern North Dakota. More recent yield experience likely have a higher weight in forming yield expectations for the current year. Farmers in high yielding areas should be cautious of building in too high of yield expectations. Differences in yields will have impacts on financial performance.
Analysis
Yield data were collected for counties in and near the corn-belt from the National Agricultural Statistical Service (NASS). Actual corn yields were collected from 1972 through 2016, and a trend line was fit through the data. Average deviations from trend then were calculated for each year from 2013 through 2016. Deviation calculations were begun in 2013, the year after the major drought occurring in 2012. The deviations then were average for the years from 2013 to 2016.
The process is illustrated for corn in Piatt County, Illinois. Actual data and trend yields are shown in Figure 1. Deviations from trend are:
2013: 0 bushel per acre difference = 187 actual yield - 187 trend yield
2014: 46 bushels per acre difference = 235 actual yield - 189 trend yields
2015: 30 bushels per acre difference = 221 actual yield - 191 trend yield
2016: 26 bushels per acre difference = 219 actual yield - 193 trend yield
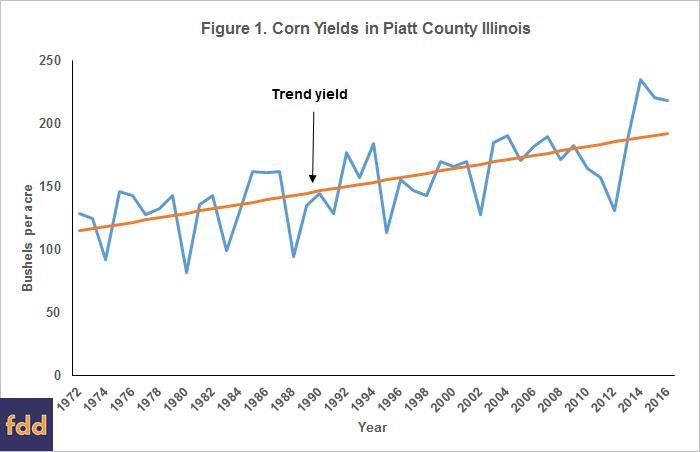
From 2013 to 2016, Piatt County yields averaged 26 bushels per acre higher than trend yields for Piatt County. These have been exceptionally good yields. When valued at a $3.50 corn price, a 26 bushel per acre above trend yield adds $91 in crop revenue per acre per year. This obviously has impacts on incomes.
Similar calculations to that made for Piatt County were made for other counties. Average yield deviations are reported in maps for corn and soybeans in the following two sub-sections.
Corn Deviations from Trend
Most counties in Illinois had large positive deviations from county yields since 2012 (see Figure 2). Of the counties for which complete data existed, 61 counties out of 102 counties had county yields that averaged 10 bushels above trend. Only one county had the same average yield as trend yield (Iroquois County) and one county had an average below trend (Kankakee County at three bushels below trend). Other areas with many counties well above trend include Kentucky, southern Indiana, southern Ohio, southern Iowa, Missouri, eastern Nebraska, and southeast South Dakota.
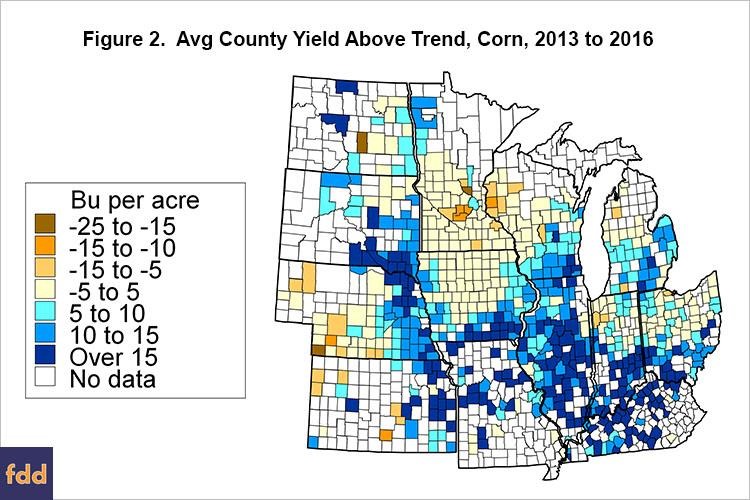
On the other hand, there were large areas with counties having yield deviations near average. These areas include northern and central Iowa, much of Minnesota, northern Indiana, and northern and central Ohio.
Soybean Deviations from Trend
Similar to corn, soybean yields have averaged above trend for most counties in Illinois (see Figure 3), with 31 counties have an average yield 5 bushels over trend. Other areas with yields above trend were Kentucky, southern Illinois, southern Ohio, eastern South Dakota, eastern Nebraska, and eastern Kansas.
Source:farmdocdaily