By Gary Schnitkey
Department of Agricultural and Consumer Economics
University of Illinois
In recent weeks, cash corn prices have declined by $.50 per bushel and soybean prices by $1.80 per bushel, resulting in much lower 2018 income expectations. Crop revenue and returns are projected for corn and soybeans on high-productivity farmland in central Illinois. These per acre returns then are used to project 2018 net income on a 1,500 acre grain farm. At prices of $3.40 for corn and $8.45 for soybeans, 2018 net incomes could approach the average for the past two years if three conditions are met: 1) a significant amount of grain produced in 2017 was sold in 2018 for a marketing gain, 2) at least 25% of 2018 expected production was forward contracted at prices above those currently offered by the market, and 3) yields are at high levels similar to those in the past several years. Not meeting any of these conditions could result in much lower incomes. Of course, price increases could change the income outlook.
Crop Revenue and Return
Most farm income statements are calculated using modified cost principles. Under this approach, gross revenue from crops include 1) crop revenue and 2) change in crop inventory values beginning and ending of the year. Often, differences between the beginning of the year inventory values and old-crop sales prices have significant impacts on gross revenue (farmdoc daily, May 10, 2016, for more discussion). Those marketing gains will be a significant source of income on many farms in 2018.
Table 1 shows an example of income calculation for corn and soybeans grown on high-productivity farmland in central Illinois. Several assumptions are used in the construction of gross revenue. The first set relates to gains on old crop sales. The farm is assumed to have had 110 bushels per acre of corn in storage at the beginning of the year. The 110 bushels value represents about one-half of 2017 production. For 2017 income statement preparation, this inventory was valued at $3.20 on the 2017 end-of-year balance sheet. The $3.20 was near the cash value at the end of 2017 and was used by Illinois Farm Business Farm Management (FBFM) for valuing unsold corn inventory at the end of 2017. From the beginning of the year, corn prices rose and were higher than $3.20 throughout much of the first half of 2018. Cash corn prices in central Illinois averaged $3.55 per bushel. A $3.55 sale on old crop would result in a $.35 gain per bushel on old crop inventory. For 110 bushel of unsold corn, a $.35 per bushel gain results in a $39 per acre gain for corn (see Table 1).
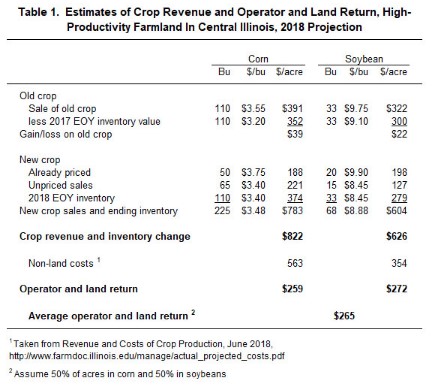
For soybean, 33 bushels per acre were assumed to be in inventory at the beginning of the year, roughly half of production. Cash prices in central Illinois averaged $9.75 during the first six months of the year, and Illinois FBFM inventory value was $9.10 per bushel, resulting in an estimated gain of $22 per acre on old crop soybean sales (see Table 1). The old-crop corn and soybean gains will have large positive impacts on 2018 income.
Yields for 2018 are projected to be very good at 225 bushels per acre for corn and 68 bushels per acre for soybeans. The 225 bushel corn yield is near averages for farms enrolled in Illinois FBFM for the last two years: 228 bushels per acre in 2016 and 227 bushels per acre in 2017 (see Revenue and Costs). Similarly, the 68 bushels per acre soybean yield is near the averages in the last two years: 69 bushels per acre in 2016 and 68 bushels per acre in 2017. Both 2016 and 2017 were excellent years, with average yields in central Illinois being near the highest on record. At this point, these yield projections are very preliminary as the key yield setting weather periods are not over. High yields are used because a certain amount of optimism exists concerning 2018 crop yields. As shown in a later section, lower yields will have a large, negative impact on incomes.
Most farmers likely priced some of 2018 production earlier in the year. A survey earlier in the year suggests that farmers hedged about 25% of expected corn production by this point in time (farmdoc daily, May 15, 2018). Hedging 25% of corn on high-productivity farmland is about 50 bushels per acre. The average bid price for fall delivery in central Illinois during the first half of 2018 was $3.75 per bushel. Given these values, already priced new crop sales of corn has $188 per acre of crop revenue (see Table 1).
For soybeans, 30 bushels are assumed to be priced for new crop, or about 30% of expected production. This value is slightly higher than for corn. The average fall delivery
price during the first half of the year was $9.90, resulting in $198 per acre of priced new crop sales for soybeans (see Table 1).
In recent weeks, corn and soybean prices have fallen dramatically. As of July 9, new crop bids in central Illinois are near $3.40 per bushel for corn and $8.45 per bushel for soybeans. These prices will be used for the remaining 2018 production. Given 225 bushels of total 2018 production, there are 175 bushels of corn to sell after taking into consideration the 50 bushels of already sold grain. The 175 bushels is divided between unpriced sales of 65 bushels per acre and end-of-year (EOY) inventory of 110 bushels per acre. Since both unpriced sales and EOY inventory are valued at $3.40 per bushel, the division between the two does not matter in 2018 income projections. Unpriced soybeans of 48 bushels per acre are similarly valued at $8.45 per bushel.
New crop sales and ending inventory are $783 per acre for corn and $604 per acre for soybeans (see Table 1). Adding old crop grain to new crop results in 2018 crop revenue and inventory change of $822 per acre for corn and $626 per acre for soybeans. Note that this is the only revenue likely from the 2018 crop as ARC likely will not make payments (farmdoc daily, May 30, 2018).
Non-land costs of $563 per acre for corn and $354 per acre for soybeans are subtracted from crop revenue to arrive at operator and land return (see Table 1). Non-land costs are taken from 2018 Illinois Crop Budgets (see Revenue and Costs). Crop revenue less non-land cost then give operator and land returns of $259 per acre for corn and $272 per acre for soybeans (see Table 1). Given that 50% of farmland is in corn and 50% is in soybean, the average operator and land return is $265 per acre.
Variability of Operator and Land Returns Across Farms
The operator and land return of $265 per acre represents a return to farmer and landowner. Under a cash rent situation, the farmer will pay the landowner a cash rent. In central Illinois, cash rents for high-productivity farmland are projected to average $264 per acre in 2018. A $264 cash rent yields a $1 per acre return to the farmer ($1 = $265 operator and land return – $264 cash rent), a break-even situation for the farmer.
The $265 operator and land return will vary depending on previous marketing decisions made by the farmer. For example, old crop sales significantly impact operator and land return. If no 2017 EOY inventory existed, gain on old crop sales would be $0 per acre (see Table 1) and average operator and land return would be reduced from $265 per acre to $235 per acre. Furthermore, the 2018 priced grain has a significant impact on returns. If all grain was priced at $3.40 for corn and $8.45 for soybean, average operator and land return is further reduced to $211 per acre.
Yields and prices impact income as well. Table 2 shows operator and land returns at different yield and price scenarios. A 225 bushels per acre corn yield and 68 bushels per acre soybean yield gives a $265 per acre average operator and return for prices of $3.40 for corn and $8.45 for soybeans. Lower yields of 215 bushels per acre for corn and 65 bushels per acre for soybeans results in a $235 per acre operator and land return (see Table 2), down by $30 from the $265 per acre at higher yields. The $235 return includes the gains on old crop sales and 2018 priced grain as shown in Table 1. Trend yields of 205 bushels per acre for corn and 63 bushels per acre for soybeans result in a $210 operator and land return. This would be a very low return and would result in negative and very low net incomes on many farms.
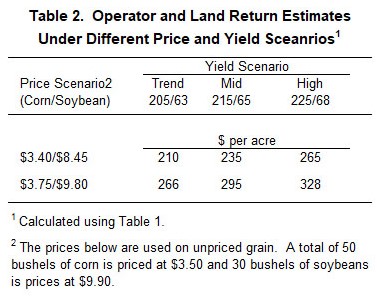
Table 2 also shows operator and land returns for bid prices of $3.75 per bushel for corn and $9.80 for soybeans, roughly the level of prices before recent declines. In this case, high yields of 225 bushels per acre of corn and 68 bushels per acre for soybeans results in a $328 of operator and land return, $63 per acre higher than the $265 estimate at a $3.40 corn price and $8.45 soybean price. Recent reductions in prices have caused a significant decrease in operator and farmland returns.
Income Projections
The $265 operator and land return is used to project income for a 1,500 grain farm with 16% of the farmland owned, 42% cash rented with a $264 cash rent, and 42% share rented with a 50-50 modified arrangement. Owned land has property tax and interest costs totaling $120 per acre. In this case, income would be projected at $77,000 per farm, near the average income for the last 2 years (see farmdoc daily, November 21, 2017).
The $77,000 net income is built on three key assumptions that will vary from farm-to-farm:
- The farm has inventory gains of $39 per acre for corn and $22 per acre for soybeans. Eliminating these gains reduces income projections by $35,000 to $42,000.
- The farm has priced 50 bushels per acre of corn at $3.75 and 20 bushels of soybeans at $9.90. Eliminating this priced grain and valuing all corn at $3.40 for corn and $8.45 for soybeans results in a $27,000 reduction of per farm income to $50,000 per farm.
- Yields will be near 2016 and 2017 averages. Lowering yields to trend levels of 205 bushels per acre for corn and 63 bushels per acre for soybeans result in a $65,000 income reduction to $12,000 per farm.
A combination of any of the three impacts listed above is additive.
Summary
Recent price declines have lowered grain farm income prospects for 2018. There still is some possibility of having near average incomes given 1) marketing gains occurred on old crop, 2) over 25% of expected production has been priced at average fall delivery bids earlier in the year, and 3) relatively high yields occur. Not meeting any of those three conditions will result in lower incomes. Rebounds in crop prices are possible, which could increase income prospects. Time will tell on this matter.
As is the usual case, there will be variability in income across farms. This year, the amount of pre-harvest hedging will be a key variable explaining differences in revenue across farms.