The losses in soybean production from some analysts are from 3-5 mmt and production in Rio Grande do Sul will be down from 22 mmt to 17 or 18 mmt. Agronegocios estimates that in a worst-case scenario the 23/24 Brazil soybean production could be as low as 140 mmt. This compares with CONAB (the Brazil government agency like the USDA) at 147.684 and the USDA at 154 mmt.
The situation in Brazil has prompted analysts at AgResource to revise their production forecast downwards. Previously estimated at 145.46 million metric tons, the latest projection now stands at 144.59 million metric tons. This downward revision accounts for the anticipated losses due to flooding in Rio Grande do Sul, estimated at 1.78 million metric tons but this estimate could be too conservative.
Moreover, the persistent wet conditions in Argentina further compound the production projections. If the soybean crop in Argentina, a key producer, falls short of expectations due to continued rainfall, the total South American soybean production could dip even lower, potentially reaching sub 200 mmt vs. last year’s total at 185 mmt.
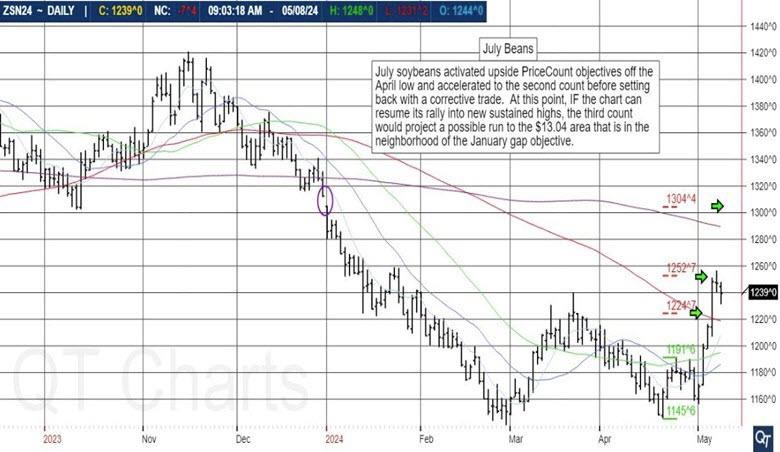
These headline grabbing weather conditions have prompted the funds to cover their short positions from a record short at the end of February at -160,653 to -41,453 short as of May 7, 2024, resulting in the nearby daily soybean futures chart to create a double bottom formation -- a potentially bullish chart pattern.

A weekly break above the celling/resistance at $12.50 could attract further fund buying and test the 200-day moving average at $12.857/bu. A close above $12.95 would trigger another long-term buy signal for a summer top of $14.25 in 3-5 weeks.
For daily information and updates on agriculture commodity marketing and price risk management for North American farmers, producers, and agribusiness visit the Farms.com Risk Management Website to subscribe to the program.