The tool also provides information on Fusarium Damaged Kernel for durum and spring wheat. And there’s enough information to create a Fusarium head blight index for all four crop types.
When accessed with field observations from over 300 farmer’s fields across the prairies, the tool’s accuracy was about 80 per cent, with Dr. Ojo noting no model is 100 per cent accurate.
When users access the map, they will be asked to input the date, crop type, variety, disease risk and province.
The map will then generate exportable results based on that information using a colour code to identify risk levels.
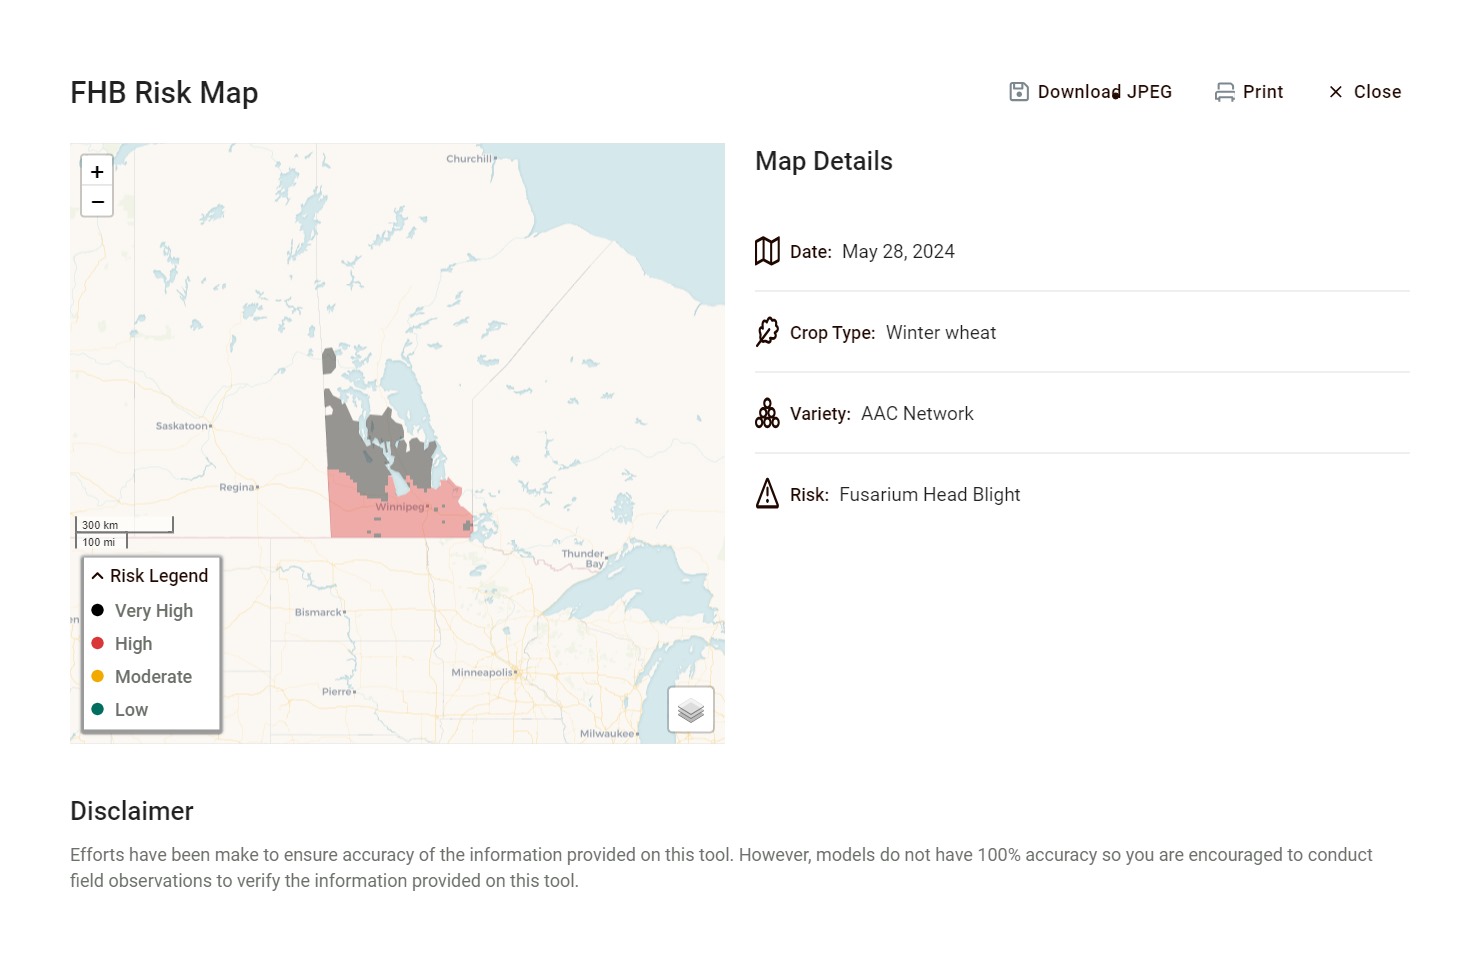
Example map screenshot
Green means low, yellow means moderate, and red represents high. A black result indicates a very high risk.
Making the tool synchronized across the Prairies is a benefit for producers.
Farmers whose farms border different provinces used to have to rely on two separate maps.
“Alberta, Saskatchewan and Manitoba all produced their own individual provincial maps,” Andrew Hector, an agronomy extension specialist with the Manitoba Crop Alliance, told Farms.com. “So, a farmer could be getting two different risk levels.
With this new tool, all of that information is harmonized for them into one map.”
Ag industry and government reps worked for three years to create the mapping tool.
Its results are based on weather data from more than 500 federal and provincial weather stations, more than 600 plot sites from 15 Western Canadian locations and validated using more than 300 producer fields between 2019 and 2021.
Farmers experienced relatively dry conditions during those years, Dr. Ojo said.
“2021 is still one of the dryest years we have on record, and in those years, we didn’t observe a high disease pressure,” he said. “2016 was the last year we had a very wet year across the Prairies.”
Producers don’t have to worry about receiving out-of-date information from the tool as it’s updated on a regular basis.
But Ojo also stresses the importance of scouting.
“We don’t have a weather station on every field, so we always recommend farmers go check their fields,” he said. “We are giving a regional outlook.”