By Charles Wortmann
Figure 1. Nebraska soybean field with patches of iron chlorosis caused by a deficiency of iron.
Interest in micronutrients has increased in recent years due to accelerated rates of nutrient removal with higher crop yields and increased availability of alternative micronutrient products. Following are several updates on micronutrient research and application for crop production.
- In Nebraska the profit potential from micronutrient application is especially good for
- foliar application of iron when corn is expressing symptoms of iron chlorosis;
- iron chelated as FeEDDHA to soybean fields with a consistent history of iron chlorosis and applied in the seed furrow at 0.5 lb/acre or as a seed dressing; and
- soil application of Zn when there are low soil test values or symptoms occur.
- The NebGuide, Micronutrient Management in Nebraska (G1830), was newly revised in 2018 to include results from three years and many locations of research by Stewart, Shapiro et al. evaluating diagnosis of deficiencies and response to soil- and foliar-applied micronutrients for corn.
- Foliar nutrient concentration results considered with other information are of diagnostic value.
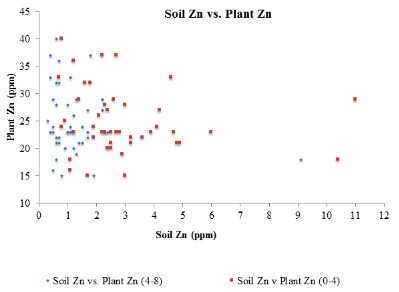
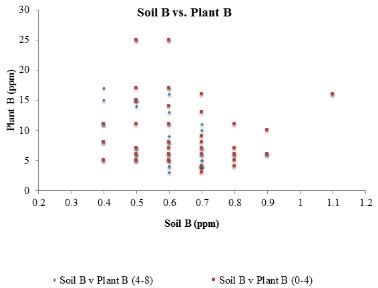
- Soil test and foliar test results for micronutrient availability vary independently (Figure 1).
- Leaf tissue results have not proven to be predictive of corn yield response to foliar application of micronutrients in Nebraska.
- When diagnosing a stressed part of a field, collect foliar samples both from stressed and unstressed areas.
- Soil test results for micronutrient nutrient availability vary with the soil test method. Micronutrient fertilizer recommendations were developed using DTPA extraction for soil testing. A common alternative is to extract the nutrients using Mehlich 3. The two methods were compared by Mundorf and Wortmann (unpublished) and results are shown for manganese and zinc in Figure 2. Micronutrient extraction was greater with Mehlich 3 including 49% for zinc (1.49 DTPA Zn) and 72% more for Mn (1.72 DTPA Mn). In addition, there was much inconsistency in results of the two methods with Mehich 3 accounting for 74% of the variation in DTPA Zn (R2 = 0.74), but only 9% of the variation in DTPA Mn.


Figure 1. There is a lack of correlation between soil and foliar tests that are indicative of nutrient availability as shown for Zn and B.
Figure 2. Soil test results with DTPA and Mehlich 3 extraction of mn and zn micronutrients are often poorly related (from unpublished work of Murdorf and Wortmann).
Current university recommendations are based on yield responses calibrated with DTPA extraction. Direct interpretation of Mehlich 3 extraction of micronutrients based on DTPA calibration is not very reliable.