CME group completed their bi-annual review of daily price limits for grain and oilseed futures traded on the Chicago Board of Trade. Daily limits will be expanded for corn – 25 cents to 40 cents; soybeans – 70 cents to $1.00; and wheat - 40 cents to 45 cents. Expanded limits (the day after a limit move is made) will now be 60 cents for corn; $1.50 for soybeans; and 70 cents for wheat. The new daily price limits will be effective May 2, 2021.
Corn
Ethanol production for the week ending April 23 was 0.945 million barrels per day, up 4,000 from the previous week. Ethanol stocks were 19.736 million barrels, down 0.711 million barrels compared to last week. Corn net sales reported by exporters for April 16-22, 2021 were up compared to last week with net sales of 20.5 million bushels for the 2020/21 marketing year and 21.8 million bushels for the 2021/22 marketing year. Exports for the same time period were up 19% from last week at 75.4 million bushels. Corn export sales and commitments were 100% of the USDA estimated total exports for the 2020/21 marketing year (September 1 to August 31) compared to the previous 5-year average of 88%. Across Tennessee, average corn basis (cash price-nearby futures price) weakened or remained unchanged at West, Mississippi River, North-Central, West-Central, and Northwest elevators and barge points. Overall, basis for the week ranged from 17 under to 36 over, with an average of 8 over the May futures at elevators and barge points. May 2021 corn futures closed at $7.40, up 85 cents since last Friday. For the week, May 2021 corn futures traded between $6.61 and $7.46. May/Jul and May/Dec future spreads were -67 and -177 cents. July 2021 corn futures closed at $6.73, up 41 cents since last Friday.
Corn | May 21 | Change | Dec 21 | Change |
Price | $7.40 | $0.85 | $5.63 | $0.13 |
Support | $6.72 | $0.42 | $5.33 | -$0.05 |
Resistance | $7.19 | $0.48 | $5.56 | -$0.03 |
20 Day MA | $6.18 | $0.37 | $5.22 | $0.22 |
50 Day MA | $5.76 | $0.16 | $4.93 | $0.11 |
100 Day MA | $5.37 | $0.14 | $4.65 | $0.08 |
4-Week High | $7.40 | $0.82 | $5.93 | $0.36 |
4-Week Low | $5.36 | $0.03 | $4.49 | $0.00 |
Technical Trend | Up | = | Up | = |
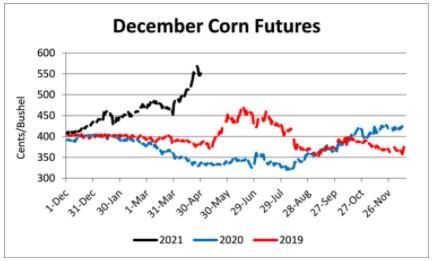
Nationally, this week’s Crop Progress report estimated corn planted at 17% compared to 8% last week, 24% last year, and a 5-year average of 20%; and corn emerged at 3% compared to 2% last week, 3% last year, and a 5-year average of 4%. In Tennessee, corn planted was estimated at 48% compared to 26% last week, 33% last year, and a 5-year average of 44%; and corn emerged at 18% compared to 5% last week, 12% last year, and a 5-year average of 15%. In Tennessee, new crop cash corn prices at elevators and barge points ranged from $5.36 to $5.92. December 2021 corn futures closed at $5.63, up 13 cents since last Friday. Downside price protection could be obtained by purchasing a $5.70 December 2021 Put Option costing 66 cents establishing a $5.04 futures floor.
Soybeans
Net sales reported by exporters were up compared to last week with net sales of 10.7 million bushels for the 2020/21 marketing year and 16.1 million bushels for the 2021/22 marketing year. Exports for the same period were up 50% compared to last week at 12.5 million bushels. Soybean export sales and commitments were 99% of the USDA estimated total annual exports for the 2020/21 marketing year (September 1 to August 31), compared to the previous 5-year average of 93%. Across Tennessee, average soybean basis strengthened or remained unchanged at West, West-Central, North-Central, and Mississippi River, and weakened at Northwest elevators and barge points. Basis ranged from 19 under to 30 over the May futures contract. Average basis at the end of the week was 11 over the May futures contract. May 2021 soybean futures closed at $15.71, up 32 cents since last Friday. For the week, May 2021 soybean futures traded between $15.24 and $16.08. May/Jul and May/Nov future spreads were -37 and -232 cents. May 2021 soybean-to-corn price ratio was 2.12 at the end of the week. July 2021 soybean futures closed at $15.34, up 18 cents since last Friday.
Soybeans | May 21 | Change | Nov 21 | Change |
Price | $15.71 | $0.32 | $13.39 | -$0.02 |
Support | $15.15 | $0.09 | $13.04 | -$0.11 |
Resistance | $15.87 | $0.21 | $13.46 | -$0.12 |
20 Day MA | $14.68 | $0.39 | $12.96 | $0.29 |
50 Day MA | $14.34 | $0.18 | $12.55 | $0.15 |
100 Day MA | $13.75 | $0.20 | $11.93 | $0.15 |
4-Week High | $16.08 | $0.59 | $13.84 | $0.38 |
4-Week Low | $13.64 | $0.00 | $11.84 | $0.00 |
Technical Trend | Up | = | Up | = |
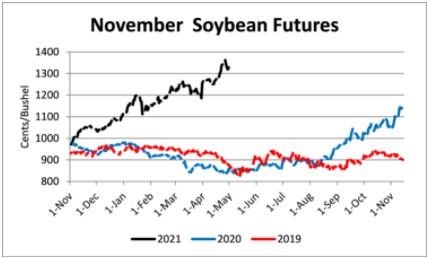
Nationally, this week’s Crop Progress report estimated soybeans planted at 8% compared to 3% last week, 7% last year, and a 5-year average of 5%. In Tennessee, soybeans planted were estimated at 8% compared to 2% last week, 7% last year, and a 5-year average of 4%. In Tennessee, new crop cash soybean prices at elevators and barge points ranged from $13.12 to $13.87. November 2021 soybean futures closed at $13.39, down 2 cents since last Friday. Downside price protection could be achieved by purchasing a $13.40 November 2021 Put Option which would cost 88 cents and set a $12.52 futures floor. Nov/Dec 2021 soybean-to-corn price ratio was 2.38 at the end of the week.
Cotton
Net sales reported by exporters were down compared to last week with net sales of 77,100 bales for the 2020/21 marketing year and 16,300 bales for the 2021/22 marketing year. Exports for the same time period were up 4% compared to last week at 341,900 bales. Upland cotton export sales were 104% of the USDA estimated total annual exports for the 2020/21 marketing year (August 1 to July 31), compared to the previous 5-year average of 102%. Delta upland cotton spot price quotes for April 29 were 84.29 cents/lb (41-4-34) and 86.54 cents/lb (31-3-35). Adjusted world price increased 3.22 cents to 73.71 cents. May 2021 cotton futures closed at 87.43, down 0.08 cents since last Friday. For the week, May 2021 cotton futures traded between 85.89 and 90.07 cents. May/Jul and May/Dec cotton futures spreads were 0.65 cents and -2.37 cents. July 2021 cotton futures closed at 88.08 cents, down 0.72 cents since last Friday.
Cotton | May 21 | Change | Dec 21 | Change |
Price | 87.43 | -0.08 | 85.06 | 0.13 |
Support | 84.32 | 0.84 | 81.26 | -1.74 |
Resistance | 89.04 | -0.70 | 87.84 | 1.52 |
20 Day MA | 83.97 | 1.99 | 82.78 | 1.65 |
50 Day MA | 85.33 | -0.13 | 82.94 | 0.09 |
100 Day MA | 83.12 | 0.77 | 80.00 | 0.74 |
4-Week High | 90.07 | 2.34 | 87.43 | 2.07 |
4-Week Low | 77.65 | 0.53 | 77.27 | 1.93 |
Technical Trend | Up | = | Up | = |
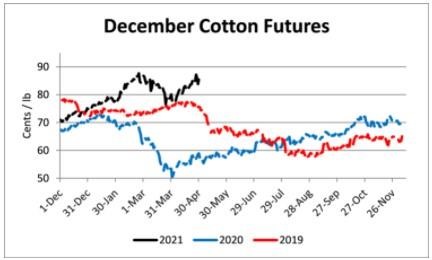
Nationally, this week’s Crop Progress report estimated cotton planted at 12% compared to 11% last week, 13% last year, and a 5-year average of 11%. In Tennessee, cotton planted was estimated at 1% compared to 0% last week, 2% last year, and a 5-year average of 2% December 2021 cotton futures closed at 85.06 cents, up 0.13 cents since last Friday. Downside price protection could be obtained by purchasing an 86 cent December 2021 Put Option costing 8.44 cents establishing a 77.56 cent futures floor.
Wheat
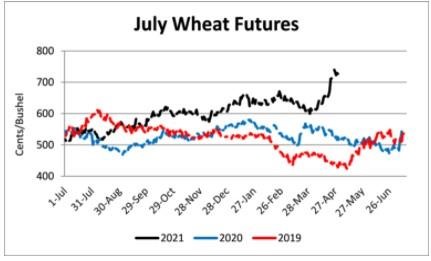
Wheat net sales reported by exporters were down compared to last week with net sales of 8.2 million bushels for the 2020/21 marketing year and net sales of 8.7 million bushels for the 2021/22 marketing year. Exports for the same time period were down 2% from last week at 20.2 million bushels. Wheat export sales were 96% of the USDA estimated total annual exports for the 2020/21 marketing year (June 1 to May 31), compared to the previous 5-year average of 104%. In Tennessee, spot wheat prices ranged from $7.29 to $7.75. May 2021 wheat futures closed at $7.42, up 32 cents since last Friday. May 2021 wheat futures traded between $7.12 and $7.73 this week. May wheat-to-corn price ratio was 1.01. May/Jul and May/Sep future spreads were -8 and -10 cents.
Wheat | May 21 | Change | Jul 21 | Change |
Price | $7.42 | $0.32 | $7.34 | $0.22 |
Support | $7.03 | $0.09 | $7.06 | $0.11 |
Resistance | $7.55 | $0.33 | $7.45 | $0.22 |
20 Day MA | $6.70 | $0.31 | $6.70 | $0.30 |
50 Day MA | $6.53 | $0.08 | $6.48 | $0.09 |
100 Day MA | $6.45 | $0.07 | $6.37 | $0.07 |
4-Week High | $7.73 | $0.59 | $7.69 | $0.54 |
4-Week Low | $5.93 | $0.00 | $5.92 | $0.00 |
Technical Trend | Up | = | Up | = |
Nationally, the Crop Progress report estimated winter wheat condition at 49% good-to-excellent and 19% poor to very poor; winter wheat headed at 17% compared to 10% last week, 20% last year, and a 5-year average of 23%; spring wheat planted at 28% compared to 19% last week, 13% last year, and a 5-year average of 19%; and spring wheat emerged at 7% compared to 4% last year and a 5-year average of 5%. In Tennessee, winter wheat condition was estimated at 74% good-to-excellent and 3% poor to very poor; winter wheat headed at 33% compared to 10% last week, 53% last year, and a 5-year average of 41%; and winter wheat jointing at 88% compared to 79% last week, 94% last year, and a 5-year average of 92%. In Tennessee, new crop wheat cash contracts ranged from $7.06 to $7.64. July wheat-to-corn futures price ratio was1.09. July 2021 wheat futures closed at $7.34, up 22 cents since last Friday. Downside price protection could be obtained by purchasing a $7.35 July 2021 Put Option costing 44 cents establishing a $6.91 futures floor. September 2021 wheat futures closed at $7.32, up 20 cents since last Friday.
Source : tennessee.edu