Overview
Corn, cotton, soybeans, and wheat were down for the week.
Volatility was one of the themes for this week’s crop futures markets. Nearby cotton futures had a range of 6.47 cents, soybeans $0.68, corn $0.25, and wheat $0.25. Swings of this magnitude can add stress to an already challenging decision of when to sell production. When making pricing decisions producers will need to consider: 1) liquidity – If you are using hedging strategies that require margin make sure you have sufficient liquidity and financial support from you agricultural lender; 2) downside protection – This will come at cost, but may be worth it to remove price uncertainty to the downside; and 3) upside potential – Some strategies ( for, example, short hedge and cash forward contracts) do not allow for taking advantage of further rallies, however producers may want to consider using options strategies that can augment existing (or stand-alone) pricing strategies (these come at a premium cost).
This week the USDA released the monthly WASDE report. The report provided limited changes compared to February. Most market analysts were anticipating revisions for higher exports and lower ending stocks, so the report did not live up to the bullish pre-report bias. The next major report will be the USDA’s Prospective Plantings report at the end of March. The report will give a glimpse at intended planted acreage. Given strong prices across many commodities acres will be very competitive. The Northern Plains will be watched closely for acreage shifts, particularly for corn and soybeans.
Row crop prices have not been the only prices on the move this winter. Input prices have increased substantially. Fertilizer prices are up 8-56% depending on the product, diesel prices are up, and crop insurance premiums are up (higher protection which is good but an added up front cost. Also, if you rent land on a share agreement, you should be anticipating paying more if yields cooperate and prices remain at current levels. For example, a straight 25% crop share (no shared expenses) could be 170 bu/acre x $4.85 = $824.50/acre x 25% = $206.13/acre. Revisiting crop budgets for your farm is strongly advised.
Corn
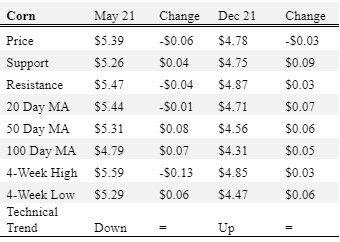
Ethanol production for the week ending March 5 was 0.938 million barrels per day, up 89,000 barrels from the previous week. Ethanol stocks were 22.070 million barrels, down 0.355 million barrels compared to last week. Corn net sales reported by exporters for February 26-March 4 were up compared to last week with net sales of 15.6 million bushels (a marketing year low) for the 2020/21 marketing year and 11.3 million bushels for the 2021/22 marketing year. Exports for the same time period were down 21% from last week at 62.7 million bushels (a marketing year high). Corn export sales and commitments were 90% of the USDA estimated total exports for the 2020/21 marketing year (September 1 to August 31) compared to the previous 5-year average of 73%. Across Tennessee, average corn basis (cash price-nearby futures price) strengthened or remained unchanged at North-Central, Northwest, West-Central, West, and Mississippi River elevators and barge points. Overall, basis for the week ranged from 10 over to 41 over, with an average of 29 over the May futures at elevators and barge points. May 2021 corn futures closed at $5.39, down 6 cents since last Friday. For the week, May 2021 corn futures traded between $5.31 and $5.56. May/Jul and May/Dec future spreads were -11 and -61 cents. July 2021 corn futures closed at $5.28, down 6 cents since last Friday.

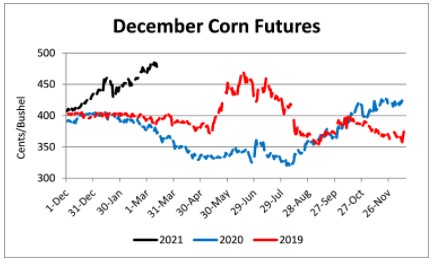
In Tennessee, new crop cash corn prices at elevators and barge points ranged from $4.60 to $5.06. December 2021 corn futures closed at $4.78, down 3 cents since last Friday. Downside price protection could be obtained by purchasing a $4.80 December 2021 Put Option costing 48 cents establishing a $4.32 futures floor

Soybeans
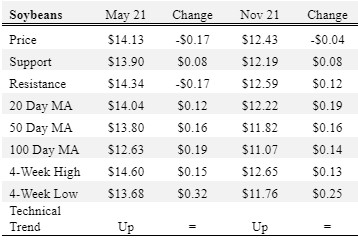
Net sales reported by exporters were up compared to last week with net sales of 12.9 million bushels for the 2020/21 marketing year and 7.8 million bushels for the 2021/22 marketing year. Exports for the same period were down 36% compared to last week at 25.9 million bushels. Soybean export sales and commitments were 99% of the USDA estimated total annual exports for the 2020/21 marketing year (September 1 to August 31), compared to the previous 5-year average of 85%. Across Tennessee, average soybean basis weakened or remained unchanged at West-Central, North-Central, Northwest, and Mississippi River and strengthened at West elevators and barge points. Basis ranged from 5 over to 35 over the May futures contract. Average basis at the end of the week was 17 over the May futures contract. May 2021 soybean futures closed at $14.13, down 17 cents since last Friday. For the week, May 2021 soybean futures traded between $13.92 and $14.60. May/Jul and May/Nov future spreads were -11 and -170 cents. May 2021 soybean-to-corn price ratio was 2.62 at the end of the week. July 2021 soybean futures closed at $14.02, down 11 cents since last Friday.

In Tennessee, new crop cash soybean prices at elevators and barge points ranged from $12.34 to $12.98. November 2021 soybean futures closed at $12.43, down 4 cents since last Friday. Downside price protection could be achieved by purchasing a $12.60 November 2021 Put Option which would cost 99 cents and set an $11.61 futures floor. Nov/Dec 2021 soybean-to-corn price ratio was 2.60 at the end of the week.
Cotton
Net sales reported by exporters were up compared to last week with net sales of 212,000 bales for the 2020/21 marketing year and 92,200 bales for the 2021/22 marketing year. Exports for the same time period were down 7% compared to last week at 351,600 bales. Upland cotton export sales were 96% of the USDA estimated total annual exports for the 2020/21 marketing year (August 1 to July 31), compared to the previous 5-year average of 91%. Delta upland cotton spot price quotes for March 11 were 85.6 cents/lb (41-4-34) and 87.85 cents/lb (31-3-35). Adjusted World Price (AWP) decreased 3.25 cents to 73.95 cents. May 2021 cotton futures closed at 87.56, down 0.2 cents since last Friday. For the week, May 2021 cotton futures traded between 82.87 and 89.34 cents. May/Jul and May/Dec cotton futures spreads were 1.01 cents and -3.54 cents. July 2021 cotton futures closed at 88.57 cents, down 0.1 cents since last Friday.