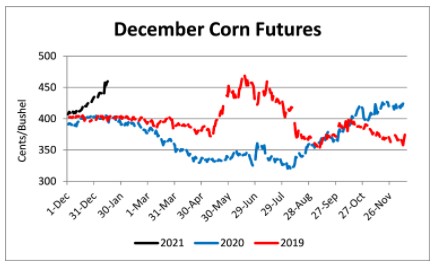
Ethanol production for the week ending January 8 was 0.941 million barrels per day, up 6,000 barrels from the previous week. Ethanol stocks were 23.692 million barrels, up 0.408 million barrels compared to last week. Corn net sales reported by exporters for January 1-7 were up compared to last week with net sales of 56.6 million bushels for the 2020/21 marketing year. Exports for the same time period were up 43% from last week at 57.6 million bushels. Corn export sales and commitments were 70% of the USDA estimated total exports for the 2020/21 marketing year (September 1 to August 31) compared to the previous 5-year average of 54%. Across Tennessee, average corn basis (cash price-nearby futures price) strengthened or remained unchanged at Northwest, North-Central, West-Central, and West and weakened at Mississippi River elevators and barge points. Overall, basis for the week ranged from 5 over to 46 over, with an average of 26 over the March futures at elevators and barge points. March 2021 corn futures closed at $5.31, up 35 cents since last Friday. For the week, March 2021 corn futures traded between $4.89 and $5.41. Mar/May and Mar/Dec future spreads were 3 and -71 cents. May 2021 corn futures closed at $5.34, up 37 cents since last Friday.
Corn | Mar 21 | Change | Dec 21 | Change |
Price | $5.31 | $0.35 | $4.60 | $0.20 |
Support | $5.05 | $0.16 | $4.40 | $0.04 |
Resistance | $5.47 | $0.44 | $4.67 | $0.22 |
20 Day MA | $4.79 | $0.24 | $4.35 | $0.10 |
50 Day MA | $4.46 | $0.12 | $4.18 | $0.07 |
100 Day MA | $4.17 | $0.08 | $4.03 | $0.03 |
4-Week High | $5.41 | $1.39 | $4.65 | $0.21 |
4-Week Low | $4.23 | $0.05 | $4.10 | $0.03 |
Technical Trend | Up | = | Up | = |
December 2021 corn futures closed at $4.60, up 20 cents since last Friday. Downside price protection could be obtained by purchasing a $4.70 December 2021 Put Option costing 52 cents establishing a $4.18 futures floor.
Soybeans
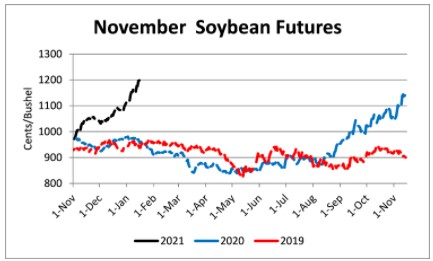
Net sales reported by exporters were up compared to last week with net sales of 33.4 million bushels for the 2020/21 marketing year and 12.0 million bushels for the 2021/22 marketing year. Exports for the same period were up 10% compared to last week at 75.0 million bushels. Soybean export sales and commitments were 92% of the USDA estimated total annual exports for the 2020/21 marketing year (September 1 to August 31), compared to the previous 5-year average of 74%. Across Tennessee, average soybean basis strengthened or remained unchanged at West-Central, Mississippi River, West, North-Central, and Northwest elevators and barge points. Basis ranged from 3 under to 42 over the March futures contract. Average basis at the end of the week was 27 over the March futures contract. March 2021 soybean futures closed at $14.16, up 42 cents since last Friday. For the week, March 2021 soybean futures traded between $13.54 and $14.36. Mar/May and Mar/Nov future spreads were -2 and -219 cents. May 2021 soybean futures closed at $14.14, up 43 cents since last Friday. March 2021 soybean-to-corn price ratio was 2.67 at the end of the week.
Soybeans | Mar 21 | Change | Nov 21 | Change |
Price | $14.16 | $0.42 | $11.97 | $0.36 |
Support | $13.90 | $0.58 | $11.53 | $0.16 |
Resistance | $14.55 | $0.48 | $12.15 | $0.34 |
20 Day MA | $13.20 | $0.58 | $11.26 | $0.31 |
50 Day MA | $12.23 | $0.36 | $10.74 | $0.21 |
100 Day MA | $11.18 | $0.24 | $10.18 | $0.13 |
4-Week High | $14.36 | $0.50 | $12.03 | $0.34 |
4-Week Low | $11.84 | $0.34 | $10.59 | $0.20 |
Technical Trend | Up | = | Up | = |
November 2021 soybean futures closed at $11.97, up 36 cents since last Friday. Downside price protection could be achieved by purchasing a $12.00 November 2021 Put Option which would cost 209 cents and set an $11.11 futures floor. Nov/Dec 2021 soybean-to-corn price ratio was 2.60 at the end of the week.
Cotton
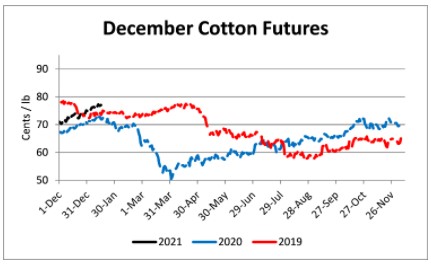
Net sales reported by exporters were up compared to last week with net sales of 326,000 bales for the 2020/21 marketing year and 50,300 bales for the 2021/22 marketing year. Exports for the same time period were up 2% compared to last week at 274,600 bales. Upland cotton export sales were 84% of the USDA estimated total annual exports for the 2020/21 marketing year (August 1 to July 31), compared to the previous 5-year average of 74%. Delta upland cotton spot price quotes for January 14 were 79.15 cents/lb (41-4-34) and 81.40 cents/lb (31-3-35). Adjusted World Price (AWP) increased 0.98 cents to 66.23 cents. March 2021 cotton futures closed at 80.7, up 0.93 cents since last Friday. For the week, March 2021 cotton futures traded between 78.65 and 82.08 cents. Mar/May and Mar/Dec cotton futures spreads were 0.92 cents and -3.68 cents. May 2021 cotton futures closed at 81.62 cents, up 1.07 cents since last Friday.
Cotton | Mar 21 | Change | Dec 21 | Change |
Price | 80.70 | 0.93 | 77.02 | 0.83 |
Support | 80.08 | 1.02 | 76.21 | 0.57 |
Resistance | 81.74 | 1.00 | 77.53 | 0.41 |
20 Day MA | 78.48 | 1.54 | 75.09 | 1.00 |
50 Day MA | 74.80 | 1.05 | 72.50 | 0.79 |
100 Day MA | 71.42 | 0.79 | 69.84 | 0.63 |
4-Week High | 82.08 | 1.15 | 77.45 | 0.56 |
4-Week Low | 74.28 | 2.42 | 72.15 | 1.25 |
Technical Trend | Up | = | Up | = |
December 2021 cotton futures closed at 77.02 cents, up 0.83 cents since last Friday. Downside price protection could be obtained by purchasing a 78 cent December 2021 Put Option costing 6.53 cents establishing a 71.47 cent futures floor.
Wheat
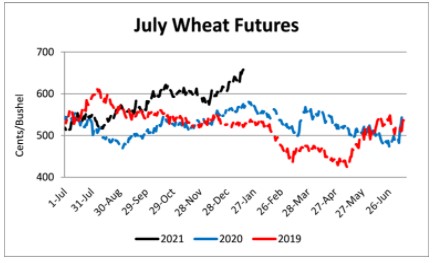
Wheat net sales reported by exporters were down compared to last week with net sales of 8.2 million bushels for the 2020/21 marketing year and 0.4 million bushels for 2021/22 marketing year. Exports for the same time period were down 14% from last week at 13.2 million bushels. Wheat export sales were 79% of the USDA estimated total annual exports for the 2020/21 marketing year (June 1 to May 31), compared to the previous 5-year average of 81%. March 2021 wheat futures closed at $6.75, up 37 cents since last Friday. March 2021 wheat futures traded between $6.28 and $6.93 this week. March wheat-to-corn price ratio was 1.27. Mar/May and Mar/Jul future spreads were 1 and -18 cents. May 2021 wheat futures closed at $6.76, up 36 cents since last Friday.
Wheat | Mar 21 | Change | Jul 21 | Change |
Price | $6.75 | $0.37 | $6.57 | $0.26 |
Support | $6.45 | $0.20 | $6.37 | $0.19 |
Resistance | $6.85 | $0.29 | $6.80 | $0.35 |
20 Day MA | $6.37 | $0.15 | $6.27 | $0.13 |
50 Day MA | $6.13 | $0.05 | $6.09 | $0.05 |
100 Day MA | $5.98 | $0.07 | $5.95 | $0.06 |
4-Week High | $6.93 | $0.29 | $6.70 | $0.24 |
4-Week Low | $5.89 | $0.22 | $5.88 | $0.17 |
Technical Trend | Up | = | Up | = |
In Tennessee, new crop wheat cash contracts ranged from $6.42 to $6.69. July 2021 wheat futures closed at $6.57, up 26 cents since last Friday. Downside price protection could be obtained by purchasing a $6.60 July 2021 Put Option costing 56 cents establishing a $6.04 futures floor.
Source : tennessee.edu