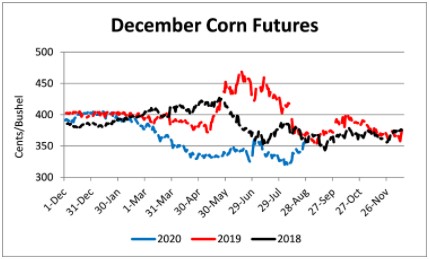
Ethanol production for the week ending August 21 was 0.931 million barrels per day, up 5,000 barrels from the previous week. Ethanol stocks were 20.409 million barrels, up 0.139 million barrels compared to last week. Corn net sales reported by exporters for August 14-20 were up compared to last week with net sales of 10.6 million bushels for the 2019/20 marketing year and 46.5 million bushels for the 2020/21 marketing year. Exports for the same time period were down 22% from last week at 37.0 million bushels. Corn export sales and commitments were 98% of the USDA estimated total exports for the 2019/20 marketing year (September 1 to August 31) compared to the previous 5-year average of 104%. Across Tennessee, average corn basis (cash price-nearby futures price) weakened at Mississippi River and strengthened or remained unchanged at Northwest, West-Central, North-Central, and West elevators and barge point. Overall, basis for the week ranged from 5 under to 20 over, with an average of 9 over the September futures. September 2020 corn futures closed at $3.46, up 19 cents since last Friday. For the week, September 2020 corn futures traded between $3.27 and $3.47. Sep/Dec and Sep/Mar future spreads were 13 and 23 cents.
Corn | Sep 20 | Change | Dec 20 | Change |
Price | $3.46 | $0.19 | $3.59 | $0.19 |
Support | $3.36 | $0.18 | $3.50 | $0.17 |
Resistance | $3.48 | $0.20 | $3.63 | $0.20 |
20 Day MA | $3.24 | $0.06 | $3.37 | $0.07 |
50 Day MA | $3.28 | $0.01 | $3.38 | $0.01 |
100 Day MA | $3.28 | $0.00 | $3.38 | $0.00 |
4-Week High | $3.46 | $0.14 | $3.59 | $0.13 |
4-Week Low | $3.07 | $0.00 | $3.20 | $0.00 |
Technical Trend | Up | = | Up | = |
Nationally the Crop Progress report estimated corn condition at 64% good-to-excellent and 12% poor-to-very poor; corn dough at 88% compared to 76% last week, 66% last year, and a 5-year average of 82%; corn dented at 44% compared to 23% last week, 24% last year, and a 5-year average of 39%; and corn mature at 5% compared to 2% last year and a 5-year average of 5%. In Tennessee, the Crop Progress report estimated corn condition at 72% good-to-excellent and 5% poor-to-very poor; corn dough at 94% compared to 86% last week, 95% last year, and a 5-year average of 97%; corn dented at 62% compared to 43% last week, 74% last year, and a 5-year average of 78%; and corn mature at 6% compared to 16% last year and a 5-year average of 18%. In Tennessee, new crop cash corn contracts ranged from $3.20 to $3.64. December 2020 corn futures closed at $3.59, up 19 cents since last Friday. Downside price protection could be obtained by purchasing a $3.60 December 2020 Put Option costing 13 cents establishing a $3.47 futures floor. March 2021 corn futures closed at $3.69, up 16 cents since last Friday.
Soybeans
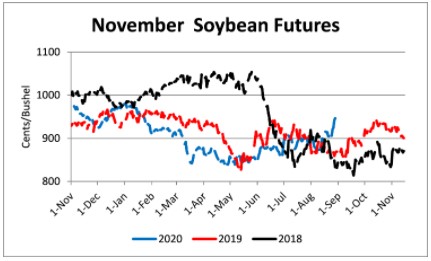
Net sales reported by exporters were down compared to last week with net sales of 1.9 million bushels for the 2019/20 marketing year and 68.9 million bushels for the 2020/21 marketing year. Exports for the same period were up 42% compared to last week at 46.9 million bushels. Soybean export sales and commitments were 106% of the USDA estimated total annual exports for the 2019/20 marketing year (September 1 to August 31), compared to the previous 5-year average of 104%. Across Tennessee, average soybean basis strengthened at North-Central and weakened at Northwest, West-Central, West, and Mississippi River elevators and barge points. Basis ranged from 1 over to 35 over the September futures contract. Average basis at the end of the week was 18 over the September futures contract. September 2020 soybean futures closed at $9.50, up 50 cents since last Friday. For the week, September 2020 soybean futures traded between $8.96 and $9.52. Sep/Nov and Sep/Jan future spreads were 0 and 6 cents. September soybean-to-corn price ratio was 2.75 at the end of the week.
Soybeans | Sep 20 | Change | Nov 20 | Change |
Price | $9.50 | $0.50 | $9.50 | $0.46 |
Support | $9.09 | $0.17 | $9.13 | $0.19 |
Resistance | $9.57 | $0.38 | $9.63 | $0.42 |
20 Day MA | $8.98 | $0.09 | $9.01 | $0.10 |
50 Day MA | $8.89 | $0.05 | $8.93 | $0.05 |
100 Day MA | $8.71 | $0.03 | $8.75 | $0.03 |
4-Week High | $9.51 | $0.34 | $9.51 | $0.32 |
4-Week Low | $8.63 | $0.00 | $8.65 | $0.00 |
Technical Trend | Up | = | Up | = |
Nationally the Crop Progress report estimated soybean condition at 69% good-to-excellent and 8% poor-to-very poor; soybeans setting pods at 92% compared to 84% last week, 76% last year, and a 5-year average of 87%; and soybeans dropping leaves at 4% compared to 2% last year and a 5-year average of 4%. In Tennessee, soybean condition was estimated at 72% good-to-excellent and 6% poor-to-very poor; soybeans blooming at 96% compared to 92% last week, 92% last year, and a 5-year average of 96%; soybeans setting pods at 82% compared to 73% last week, 80% last year, and a 5-year average of 86%; and soybeans dropping leaves at 2% compared to 3% last year and a 5-year average of 1%. In Tennessee, new crop soybean cash contracts ranged from $8.94 to $9.76. Nov/Dec 2020 soybean-to-corn price ratio was 2.65 at the end of the week. November 2020 soybean futures closed at $9.50, up 46 cents since last Friday. Downside price protection could be achieved by purchasing a $9.60 November 2020 Put Option which would cost 31 cents and set a $9.29 futures floor. January 2021 soybean futures closed at $9.56, up 45 cents since last Friday.
Cotton
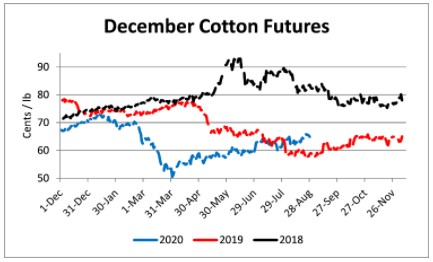
Net sales reported by exporters were up compared to last week with net sales of 156,600 bales for the 2020/21 marketing year and 7,900 for 2021/22 marketing year. Exports for the same time period were down 34% compared to last week at 277,500 bales. Upland cotton export sales were 49% of the USDA estimated total annual exports for the 2020/21 marketing year (August 1 to July 31), compared to the previous 5-year average of 46%. Delta upland cotton spot price quotes for August 27 were 60.26 cents/lb (41-4-34) and 62.51 cents/lb (31-3-35). Adjusted World Price (AWP) increased 1.9 cents to 50.5 cents.
otton | Dec 20 | Change | Mar 21 | Change |
Price | 65.08 | 0.80 | 65.93 | 0.73 |
Support | 64.08 | 1.72 | 65.01 | 1.65 |
Resistance | 66.00 | 0.20 | 66.79 | 0.15 |
20 Day MA | 64.00 | 0.88 | 64.84 | 0.93 |
50 Day MA | 62.70 | 0.63 | 63.44 | 0.66 |
100 Day MA | 60.26 | 0.65 | 61.05 | 0.64 |
4-Week High | 66.45 | 1.40 | 67.22 | 1.52 |
4-Week Low | 60.80 | 1.29 | 61.53 | 1.27 |
Technical Trend | Up | = | Up | = |
Nationally, the Crop Progress report estimated cotton condition at 46% good-to-excellent and 25% poor-to-very poor; cotton setting bolls at 88% compared to 80% last week, 89% last year, and a 5-year average of 89%; and cotton bolls opening at 22% compared to 15% last week, 27% last year, and a 5-year average of 19%. In Tennessee, cotton condition was estimated at 67% good-to-excellent and 17% poor-to-very poor; cotton setting bolls at 95% compared to 88% last week, 96% last year, and a 5-year average of 95%; and cotton bolls opening at 2% compared to 7% last year and a 5-year average of 11%. December 2020 cotton futures closed at 65.08, up 0.8 cents since last Friday. For the week, December 2020 cotton futures traded between 64.21 and 66.45 cents. Dec/Mar and Dec/Dec cotton futures spreads were 0.85 cent and 0.13 cent. Downside price protection could be obtained by purchasing a 66 cent December 2020 Put Option costing 2.76 cents establishing a 63.24 cent futures floor. March 2021 cotton futures closed at 65.93 cents, up 0.73 cents since last Friday. December 2021 cotton futures closed at 65.21 cents, up 0.85 cents since last Friday.
Wheat
Wheat net sales reported by exporters were up compared to last week with net sales of 28.1 million bushels for the 2020/21 marketing year and 0.4 million bushels for the 2021/22 marketing year. Exports for the same time period were up 59% from last week at 23.8 million bushels. Wheat export sales were 45% of the USDA estimated total annual exports for the 2020/21 marketing year (June 1 to May 31), compared to the previous 5-year average of 45%.
Wheat | Sep 20 | Change | Jul 21 | Change |
Price | $5.39 | $0.12 | $5.61 | $0.15 |
Support | $5.26 | $0.25 | $5.47 | $0.21 |
Resistance | $5.51 | $0.22 | $5.70 | $0.21 |
20 Day MA | $5.12 | $0.01 | $5.36 | $0.02 |
50 Day MA | $5.13 | $0.03 | $5.32 | $0.03 |
100 Day MA | $5.17 | -$0.01 | $5.34 | $0.00 |
4-Week High | $5.47 | $0.03 | $5.64 | $0.11 |
4-Week Low | $4.88 | $0.00 | $5.14 | $0.00 |
Technical Trend | Up | + | Up | + |
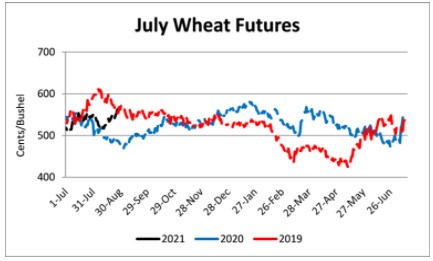
Nationally the Crop Progress report estimated winter wheat harvested at 97% compared to 93% last week, 95% last year, and a 5-year average of 98%; spring wheat condition at 71% good-to-excellent and 6% poor-to-very poor; and spring wheat harvested at 49% compared to 30% last week, 32% last year, and a 5-year average of 62%. In Tennessee, August 2020 wheat cash contracts ranged from $5.30 to $5.57. September 2020 wheat futures closed at $5.39, up 12 cents since last Friday. September 2020 wheat futures traded between $5.16 and $5.47 this week. September wheat-to-corn price ratio was 1.56. Sep/Dec and Sep/Jul future spreads were 9 and 22 cents. December 2020 wheat futures closed at $5.48, up 13 cents since last Friday. December wheat-to-corn price ratio was 1.53. July 2021 wheat futures closed at $5.61, up 15 cents since last Friday. Downside price protection could be obtained by purchasing a $5.70 July 2021 Put Option costing 38 cents establishing a $5.32 futures floor.
Source : tennessee.edu