Overview
Corn, cotton, soybeans, and wheat were up for the week.
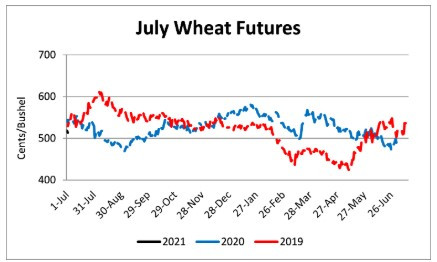
The June 30th USDA Acreage report provided substantial revisions to the March Prospective Plantings estimates. Corn acres planted were estimated at 92.006 (950,000 in Tennessee), down 4.984 million (down 90,000 acres in Tennessee) compared to the March 31 projection. Most market analysts were projecting a 1-2 million acre reduction. The larger than expected reduction triggered a 25 point rally in December corn futures. Soybean acres planted were estimated at 83.020 (1.6 million in Tennessee), down 490,000 nationally (up 100,000 acres in Tennessee). The reduction in national corn acres did not increase soybean planted acreage nationally, however in Tennessee corn acres were swapped almost one for one in favor of soybeans. November soybeans rallied over 35 cents as many analysts were projecting increased soybean acres. Upland cotton acres planted were estimated at 11.99 million (350,000 in Tennessee), down 1.485 million acres nationally (down 10,000 acres in Tennessee). December cotton futures rallied over 3 cents based on the lower acreage. All wheat acres planted were estimated at 44.250 million (310,000 in Tennessee), down 405,000 acres nationally (unchanged in Tennessee). July wheat futures rallied 12 cents in the two days following the report. Overall the report was bullish for futures prices and provided some needed positive news for commodity markets, however good growing conditions to date and substantial global and domestic stocks will continue to provide head winds for substantial price improvements. Additionally, COVID-19 demand recovery and commodity exports (particularly to China) provide a substantial source of uncertainty on the demand side.
The Grain Stocks report, also released on June 30th, received much less attention than the Acreage report. Corn stocks were estimated 1% greater than last year at 5.22 billion bushels, soybean stocks were estimated down 22% at 1.39 billion bushels, and wheat stocks were estimated down 3% at 1.04 billion bushels.
Corn
Ethanol production for the week ending June 26 was 0.900 million barrels per day, up 7,000 barrels from the previous week. Ethanol stocks were 20.164 million barrels, down 0.870 million barrels compared to last week. Corn net sales reported by exporters for June 19-25 were up compared to last week with net sales of 14.2 million bushels for the 2019/20 marketing year and 10.3 million bushels for the 2020/21 marketing year. Exports for the same time period were up 10% from last week at 56.7 million bushels – a marketing year high. Corn export sales and commitments were 94% of the USDA estimated total exports for the 2019/20 marketing year (September 1 to August 31) compared to the previous 5-year average of 100%. Across Tennessee, average corn basis (cash price-nearby futures price) strengthened at Northwest Barge Points, Northwest, and Upper-middle Tennessee and weakened at Memphis. Overall, basis for the week ranged from 20 under to 26 over, with an average of 15 over the September futures at elevators and barge points. September 2020 corn futures closed at $3.43, up 24 cents since last Friday. For the week, September 2020 corn futures traded between $3.13 and $3.53. Sep/Dec and Sep/Mar future spreads were 10 and 22 cents.
| Sep 20 | Change | Dec 20 | Change |
Price | $3.43 | $0.24 | $3.53 | $0.28 |
Support | $3.36 | $0.24 | $3.46 | $0.29 |
Resistance | $3.57 | $0.31 | $3.66 | $0.32 |
20 Day MA | $3.33 | $0.02 | $3.42 | $0.02 |
50 Day MA | $3.28 | $0.01 | $3.37 | $0.01 |
100 Day MA | $3.44 | -$0.02 | $3.52 | -$0.02 |
4-Week High | $3.53 | $0.14 | $3.63 | $0.15 |
4-Week Low | $3.15 | $0.00 | $3.22 | $0.00 |
Technical Trend | Up | + | Up | + |
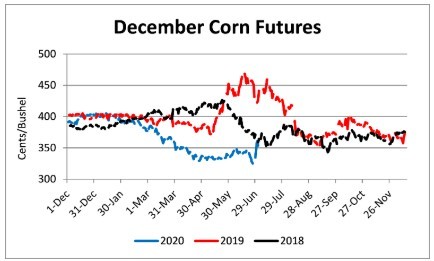
Nationally the Crop Progress report estimated corn condition at 73% good-to-excellent and 5% poor-to-very poor; and corn silking at 4% compared to 2% last week, 2% last year and a 5-year average of 7%. In Tennessee, the Crop Progress report estimated corn condition at 72% good-to-excellent and 6% poor-to-very poor; and corn silking at 17% compared to 5% last week, 45% last year, and a 5-year average of 40%. In Tennessee, new crop cash corn contracts ranged from $3.03 to $3.66. December 2020 corn futures closed at $3.53, up 28 cents since last Friday. Downside price protection could be obtained by purchasing a $3.60 December 2020 Put Option costing 25 cents establishing a $3.35 futures floor. March 2021 corn futures closed at $3.65, up 46 cents since last Friday.
Soybeans
Net sales reported by exporters were down compared to last week with net sales of 8.9 million bushels for the 2019/20 marketing year and 30.9 million bushels for the 2020/21 marketing year. Exports for the same period were up 29% compared to last week at 14.3 million bushels. Soybean export sales and commitments were 100% of the USDA estimated total annual exports for the 2019/20 marketing year (September 1 to August 31), compared to the previous 5-year average of 102%. Average soybean basis weakened at Memphis, Northwest Barge Points, and Upper-middle Tennessee and strengthened at Northwest Tennessee. Basis ranged from 14 under to 40 over the August futures contract at elevators and barge points. Average basis at the end of the week was 21 over the August futures contract. August 2020 soybean futures closed at $8.91, up 31 cents since last Friday. For the week, August 2020 soybean futures traded between $8.56 and $8.95. Aug/Sep and Aug/Nov future spreads were -1 and 5 cents. September 2020 soybean futures closed at $8.90, up 30 cents since last Friday. August/September soybean-to-corn price ratio was 2.60 at the end of the week.
Soybeans | Aug 20 | Change | Nov 20 | Change |
Price | $8.91 | $0.31 | $8.96 | $0.35 |
Support | $8.85 | $0.34 | $8.90 | $0.38 |
Resistance | $8.98 | $0.26 | $9.05 | $0.31 |
20 Day MA | $8.71 | $0.05 | $8.77 | $0.05 |
50 Day MA | $8.56 | $0.03 | $8.61 | $0.03 |
100 Day MA | $8.68 | -$0.02 | $8.72 | -$0.01 |
4-Week High | $8.95 | $0.15 | $9.03 | $0.19 |
4-Week Low | $8.53 | $0.16 | $8.56 | $0.11 |
Technical Trend | Strong Up | + | Strong Up | + |
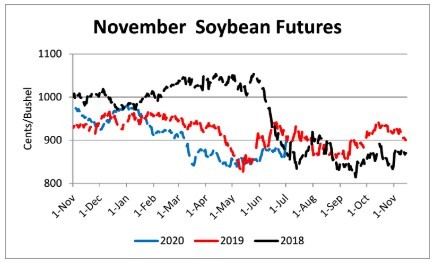
Nationally the Crop Progress report estimated soybean condition at 71% good-to-excellent and 5% poor-to-very poor; soybeans emerged at 95% compared to 89% last week, 80% last year, and a 5-year average of 91%; and soybeans blooming at 14% compared to 5% last week, 2% last year, and a 5-year average of 11%. In Tennessee, soybean condition was estimated at 76% good-to-excellent and 4% poor-to-very poor; soybeans planted at 92% compared to 86% last week, 93% last year, and a 5-year average of 91%; soybeans emerged at 82% compared to 70% last week, 83% last year, and a 5-year average of 82%; and soybeans blooming at 8% compared to 2% last week, 14% last year, and a 5-year average of 12%. In Tennessee, new crop soybean cash contracts ranged from $8.43 to $9.24. Nov/Dec 2020 soybean-to-corn price ratio was 2.54 at the end of the week. November 2020 soybean futures closed at $8.96, up 35 cents since last Friday. Downside price protection could be achieved by purchasing a $9.00 November 2020 Put Option which would cost 35 cents and set an $8.65 futures floor.
Cotton
Net sales reported by exporters were up compared to last week with net sales of 67,300 bales for the 2019/20 marketing year and 246,200 bales for the 2020/21 marketing year. Exports for the same time period were down 12% compared to last week at 277,000 bales. Upland cotton export sales were 122% of the USDA estimated total annual exports for the 2019/20 marketing year (August 1 to July 31), compared to the previous 5-year average of 107%. Delta upland cotton spot price quotes for July 2 were 61.05 cents/lb (41-4-34) and 63.3 cents/lb (31-3-35). Adjusted World Price (AWP) increased 0.53 cents to 50.13 cents.
Cotton | Dec 20 | Change | Mar 21 | Change |
Price | 62.95 | 3.45 | 63.67 | 3.51 |
Support | 62.06 | 3.11 | 62.78 | 3.18 |
Resistance | 63.42 | 3.29 | 64.14 | 3.40 |
20 Day MA | 60.04 | 0.43 | 60.67 | 0.46 |
50 Day MA | 58.78 | 0.44 | 59.51 | 0.40 |
100 Day MA | 59.35 | -0.30 | 60.20 | -0.31 |
4-Week High | 62.98 | 1.84 | 63.69 | 2.18 |
4-Week Low | 57.75 | 1.32 | 58.37 | 0.93 |
Technical Trend | Strong Up | + | Strong Up | + |
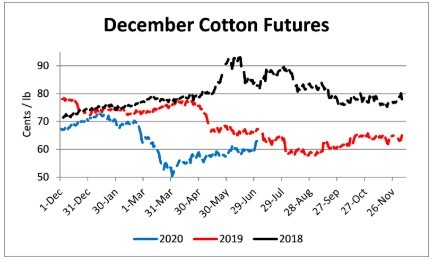
Nationally, the Crop Progress report estimated cotton condition at 41% good-to-excellent and 24% poor-to-very poor; cotton squaring at 35% compared to 27% last week, 35% last year, and a 5-year average of 36%; and cotton setting bolls at 9% compared to 6% last week, 6% last year, and a 5-year average of 7%. In Tennessee, cotton condition was estimated at 62% good-to-excellent and 16% poor-to-very poor; cotton planted at 100% compared to 96% last week, 100% last year, and a 5-year average of 100%; cotton squaring at 29% compared to 17% last week, 42% last year, and a 5-year average of 5%; and cotton setting bolls at 3% compared to 1% last year, and a 5-year average of 3%. December 2020 cotton futures closed at 62.95, up 3.45 cents since last Friday. For the week, December 2020 cotton futures traded between 58.85 and 62.98 cents. Dec/Mar and Dec/Dec cotton futures spreads were -0.98 cent and 0.72 cent. Downside price protection could be obtained by purchasing a 63 cent December 2020 Put Option costing 3.16 cents establishing a 59.84 cent futures floor. March 2021 cotton futures closed at 63.67 cents, up 3.51 cents since last Friday. December 2021 cotton futures closed at 61.97 cents, up 2.63 cents since last Friday.
Wheat
Wheat net sales reported by exporters were down compared to last week with net sales of 15.2 million bushels for the 2020/21 marketing year and 2.8 million bushels for the 2021/22 marketing year. Exports for the same time period were down 28% from last week at 18.7 million bushels. Wheat export sales were 28% of the USDA estimated total annual exports for the 2020/21 marketing year (June 1 to May 31), compared to the previous 5-year average of 30%.
Wheat | Sep 20 | Change | Jul 21 | Change |
Price | $4.92 | $0.17 | $5.13 | $0.13 |
Support | $4.82 | $0.22 | $5.06 | $0.18 |
Resistance | $5.04 | $0.08 | $5.21 | $0.05 |
20 Day MA | $4.97 | -$0.05 | $5.21 | -$0.05 |
50 Day MA | $5.10 | -$0.04 | $5.27 | -$0.03 |
100 Day MA | $5.26 | -$0.03 | $5.38 | -$0.02 |
4-Week High | $5.32 | $0.00 | $5.51 | $0.00 |
4-Week Low | $4.71 | $0.00 | $4.96 | $0.00 |
Technical Trend | Down | + | Down | + |
Nationally the Crop Progress report estimated winter wheat condition at 52% good-to-excellent and 16% poor-to-very poor; winter wheat harvested at 41% compared to 29% last week, 26% last year, and a 5-year average of 41%; spring wheat condition at 69% good-to-excellent and 6% poor-to-very poor; and spring wheat headed at 36% compared to 12% last week, 20% last year, and a 5-year average of 45%. In Tennessee, winter wheat condition was estimated at 56% good-to-excellent and 12% poor-to-very poor; winter wheat mature at 97% compared to 95% last week and 98% last year; and winter wheat harvest at 88% compared to 62% last week, 88% last year, and a 5-year average of 88%. In Tennessee, July 2020 cash contracts ranged from $4.59 to $5.09. September 2020 wheat futures closed at $4.92, up 17 cents since last Friday. September 2020 wheat futures traded between $4.75 and $4.99 this week. September wheat-to-corn price ratio was 1.43. Sep/Dec and Sep/Jul future spreads were 7 and 21 cents. December 2020 wheat futures closed at $4.99 up 15 cents since last Friday. December wheat-to-corn price ratio was 1.41. July 2021 wheat futures closed at $5.13, up 13 cents since last Friday. Downside price protection could be obtained by purchasing a $5.20 July 2021 Put Option costing 38 cents establishing a $4.82 futures floor.
Source : tennessee.edu