Corn | Jul 20 | Change | Dec 20 | Change |
Price | $3.32 | $0.02 | $3.45 | $0.03 |
Support | $3.25 | $0.03 | $3.36 | -$0.02 |
Resistance | $3.37 | $0.03 | $3.50 | $0.03 |
20 Day MA | $3.27 | $0.03 | $3.40 | $0.02 |
50 Day MA | $3.23 | -$0.01 | $3.38 | $0.00 |
100 Day MA | $3.46 | -$0.04 | $3.57 | -$0.02 |
4-Week High | $3.34 | $0.00 | $3.48 | $0.00 |
4-Week Low | $3.16 | $0.01 | $3.30 | $0.00 |
Technical Trend | Up | = | Up | = |
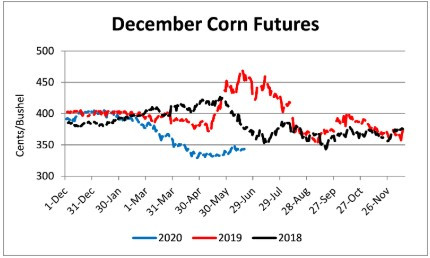
Nationally the Crop Progress report estimated corn condition at 71% good-to-excellent and 5% poor-to-very poor; and corn emerged at 95% compared to 89% last week, 74% last year, and a 5-year average of 92%. In Tennessee, the Crop Progress report estimated corn condition at 73% good-to-excellent and 4% poor-to-very poor; corn emerged at 96% compared to 86% last week, 97% last year, and a 5-year average of 98%; and corn silking at 2% compared to 6% last year and a 5-year average of 3%. In Tennessee, new crop cash corn contracts ranged from $3.16 to $3.48. September 2020 corn futures closed at $3.37, up 3 cents since last Friday. December 2020 corn futures closed at $3.45, up 3 cents since last Friday. Downside price protection could be obtained by purchasing a $3.50 December 2020 Put Option costing 23 cents establishing a $3.27 futures floor.
Soybeans
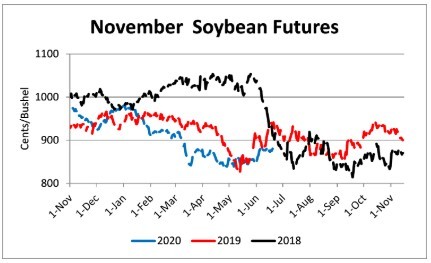
Net sales reported by exporters were down compared to last week with net sales of 19.8 million bushels for the 2019/20 marketing year and 50.8 million bushels for the 2020/21 marketing year. Exports for the same period were up 32% compared to last week at 14.2 million bushels. Soybean export sales and commitments were 98% of the USDA estimated total annual exports for the 2019/20 marketing year (September 1 to August 31), compared to the previous 5-year average of 100%. Average soybean basis strengthened or remained unchanged at Memphis, Northwest Barge Points, Upper-middle, and Northwest Tennessee. Basis ranged from 16 under to 36 over the July futures contract at elevators and barge points. Average basis at the end of the week was 16 over the July futures contract. July 2020 soybean futures closed at $8.76, up 5 cents since last Friday. For the week, July 2020 soybean futures traded between $8.60 and $8.80. Jul/Aug and Jul/Nov future spreads were 0 and 4 cents. August 2020 soybean futures closed at $8.76, up 4 cents since last Friday. July soybean-to-corn price ratio was 2.64 at the end of the week.
Soybeans | Jul 20 | Change | Nov 20 | Change |
Price | $8.76 | $0.05 | $8.80 | $0.01 |
Support | $8.67 | $0.10 | $8.69 | $0.00 |
Resistance | $8.85 | $0.11 | $8.89 | $0.06 |
20 Day MA | $8.59 | $0.07 | $8.68 | $0.07 |
50 Day MA | $8.50 | $0.01 | $8.58 | $0.02 |
100 Day MA | $8.70 | -$0.03 | $8.76 | -$0.03 |
4-Week High | $8.80 | $0.07 | $8.84 | $0.00 |
4-Week Low | $8.28 | $0.00 | $8.40 | $0.00 |
Technical Trend | Up | = | Up | = |
Nationally the Crop Progress report estimated soybean condition at 72% good-to-excellent and 4% poor-to-very poor; soybeans planted at 93% compared to 86% last week, 72% last year, and a 5-year average of 88%; and soybeans emerged at 81% compared to 67% last week, 49% last year, and a 5-year average of 75%. In Tennessee, soybean condition was estimated at 76% good-to-excellent and 4% poor-to-very poor; soybeans planted at 75% compared to 63% last week, 83% last year, and a 5-year average of 79%; and soybeans emerged at 58% compared to 44% last week, 68% last year, and a 5-year average of 63%. In Tennessee, new crop soybean cash contracts ranged from $8.53 to $9.02. Nov/Dec 2020 soybean-to-corn price ratio was 2.55 at the end of the week. November 2020 soybean futures closed at $8.80, up 1 cent since last Friday. Downside price protection could be achieved by purchasing a $9.00 November 2020 Put Option which would cost 44 cents and set an $8.56 futures floor.
Cotton
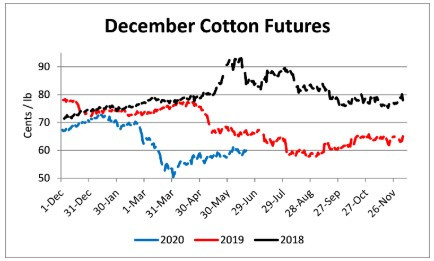
Net sales reported by exporters were down compared to last week with net sales of 97,600 bales for the 2019/20 marketing year and 148,000 bales for the 2020/21 marketing year. Exports for the same time period were up 18% compared to last week at 348,300 bales. Upland cotton export sales were 120% of the USDA estimated total annual exports for the 2019/20 marketing year (August 1 to July 31), compared to the previous 5-year average of 106%. Delta upland cotton spot price quotes for June 18 were 57.12 cents/lb (41-4-34) and 59.37 cents/lb (31-3-35). Adjusted World Price (AWP) decreased 0.73 cents to 48.87 cents. July 2020 cotton futures closed at 61.56 cents, up 1.72 cents since last Friday. For the week, July 2020 cotton futures traded between 58.69 and 62 cents. Jul/Dec and Jul/Mar cotton futures spreads were -1 cent and -1.75 cents.
Cotton | Jul 20 | Change | Dec 20 | Change |
Price | 61.56 | 1.72 | 59.81 | 0.78 |
Support | 60.56 | 1.56 | 58.96 | 0.53 |
Resistance | 62.50 | 1.70 | 60.62 | 0.69 |
20 Day MA | 59.84 | 0.58 | 59.17 | 0.20 |
50 Day MA | 57.37 | 0.84 | 57.92 | 0.60 |
100 Day MA | 59.61 | -0.55 | 60.13 | -0.57 |
4-Week High | 62.32 | 0.00 | 61.14 | 0.00 |
4-Week Low | 56.56 | 0.00 | 56.43 | 0.00 |
Technical Trend | Up | = | Up | + |
Nationally, the Crop Progress report estimated cotton condition at 43% good-to-excellent and 17% poor-to-very poor; cotton planted at 89% compared to 78% last week, 85% last year, and a 5-year average of 91%; and cotton squaring at 16% compared to 13% last week, 17% last year, and a 5-year average of 16%. In Tennessee, cotton condition was estimated at 56% good-to-excellent and 13% poor-to-very poor; cotton planted at 93% compared to 86% last week, 98% last year, and a 5-year average of 99%; and cotton squaring at 12% compared to 5% last week, 24% last year, and a 5-year average of 19%. December 2020 cotton futures closed at 59.81, up 0.78 cents since last Friday. Downside price protection could be obtained by purchasing a 60 cent December 2020 Put Option costing 3.82 cents establishing a 56.18 cent futures floor. March 2021 cotton futures closed at 60.56 cents, up 0.98 cents since last Friday.
Wheat
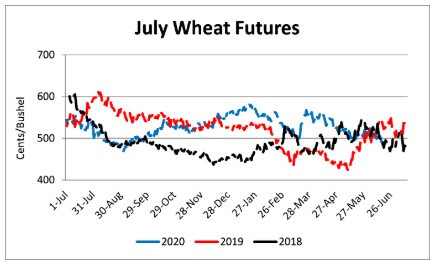
Wheat net sales reported by exporters were up compared to last week with net sales of 18.5 million bushels for the 2020/21 marketing year. Exports for the same time period were down 4% from last week at 17.9 million bushels. Wheat export sales were 25% of the USDA estimated total annual exports for the 2020/21 marketing year (June 1 to May 31), compared to the previous 5-year average of 25%.
Wheat | Jul 20 | Change | Sep 20 | Change |
Price | $4.81 | -$0.21 | $4.85 | -$0.22 |
Support | $4.71 | -$0.20 | $4.76 | -$0.21 |
Resistance | $4.90 | -$0.22 | $4.95 | -$0.23 |
20 Day MA | $5.05 | -$0.04 | $5.09 | -$0.03 |
50 Day MA | $5.17 | -$0.05 | $5.21 | -$0.05 |
100 Day MA | $5.28 | -$0.04 | $5.33 | -$0.04 |
4-Week High | $5.29 | $0.00 | $5.32 | $0.00 |
4-Week Low | $4.76 | -$0.17 | $4.81 | -$0.16 |
Technical Trend | Strong Down | = | Strong Down | = |
Nationally the Crop Progress report estimated winter wheat condition at 50% good-to-excellent and 19% poor-to-very poor; winter wheat headed at 91% compared to 85% last week, 87% last year, and a 5-year average of 94%; winter wheat harvest at 15% compared to 7% last week, 7% last year, and a 5-year average of 15%; spring wheat condition at 82% good-to-excellent and 2% poor-to-very poor; spring wheat emerged at 95% compared to 81% last week, 92% last year, and a 5-year average of 97%; and spring wheat headed at 4% compared to 2% last year and a 5-year average of 8%. In Tennessee, winter wheat condition was estimated at 51% good-to-excellent and 13% poor-to-very poor; winter wheat coloring at 99% compared to 94% last week; winter wheat mature at 69% compared to 78% last year; and winter wheat harvest at 19% compared to 7% last week, 35% last year, and a 5-year average of 33%. In Tennessee, June/July 2020 cash contracts ranged from $4.68 to $5.25. July 2020 wheat futures closed at $4.81, down 21 cents since last Friday. July 2020 wheat futures traded between $4.76 and $5.07 this week. July wheat-to-corn price ratio was 1.45. Jul/Sept and Jul/Jul future spreads were 4 and 31 cents. September 2020 wheat futures closed at $4.85, down 22 cents since last Friday. September wheat-to-corn price ratio was 1.44. July 2021 wheat futures closed at $5.12, down 18 cents since last Friday. Downside price protection could be obtained by purchasing a $5.20 July 2021 Put Option costing 39 cents establishing a $4.81 futures floor.
Source : tennessee.edu