Overview
Corn and cotton were mixed; soybeans and wheat were up for the week.
Nationally, spring planting progressed rapidly last week with corn planted increasing from 27% to 51%; soybeans planted increasing from 8% to 23%; and cotton planted increasing from 13% to 18%. Using the March Prospective Plantings report as a reference, this translates to 23.28 million acres of corn, 12.3 million acres of soybeans, and 0.673 million acres of cotton planted in the previous week. Current national acreage projections are for 96.99 million for corn, 83.51 million for soybeans, and 13.475 million for cotton.
In Tennessee progress was slowed in some areas due to rain but plantings still managed to increase 19% for corn, 12% for soybeans, and 2% for cotton or approximately 197,600 acres of corn, 180,000 acres of soybeans, and 7,200 acres of cotton planted the previous week. Tennessee is currently projected to plant 1.04 million acres of corn, 1.5 million acres of soybeans, and 360,000 acres of cotton.
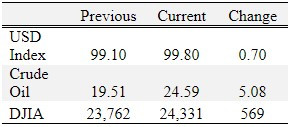
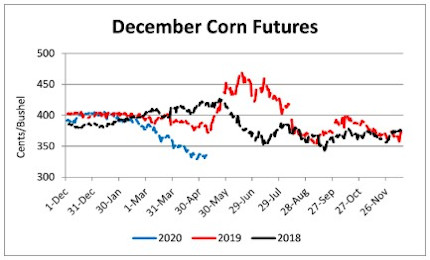
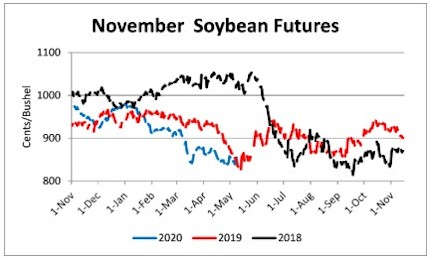
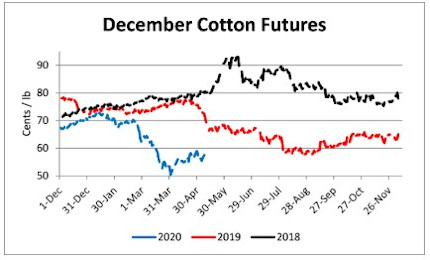
Harvest futures prices may have set a bottom with corn up 10 cents from the contract low on April 21, wheat up 26 cents since the low on March 16, soybeans up 24 cents from the low on April 21, and cotton up 7.5 cents from the low on April 2. Prices are still down dramatically lower compared to January, before the COVID-19 pandemic ravaged agricultural commodity markets. There is still time for 2020 crop prices to improve, but currently all prices are well below breakeven prices for most Tennessee producers.
To help provide support to row crop, livestock, and specialty crop producers, USDA will provide CFAP direct payments to producers. Checks are anticipated to start being mailed by the end of May or early June. Unfortunately, at this time there are more questions than answers as to how payments will be calculated and everyone will have to wait for additional details from the USDA, which may be released next week. However, in the meantime, producers are strongly encouraged to organize inventory and pricing records to make sure they can act when USDA releases CFAP program details.
Corn
Ethanol production for the week ending May 1 was 0.598 million barrels per day, up 61,000 barrels from the previous week. Ethanol stocks were 25.612 million barrels, down 0.725 million barrels compare to last week. Corn net sales reported by exporters for April 24-30 were down compared to last week with net sales of 30.5 million bushels for the 2019/20 marketing year and 3.8 million bushels for the 2020/21 marketing year. Exports for the same time period were up 33% from last week at 55.1 million bushels. Corn export sales and commitments were 86% of the USDA estimated total exports for the 2019/20 marketing year (September 1 to August 31) compared to the previous 5-year average of 90%. Across Tennessee, average corn basis (cash price-nearby futures price) strengthened at Memphis, Northwest Barge Points, Northwest, and Upper-middle Tennessee. Overall, basis for the week ranged from 12 under to 20 over, with an average of 7 over the July futures at elevators and barge points. July 2020 corn futures closed at $3.19, up 1 cent since last Friday. For the week, July 2020 corn futures traded between $3.12 and $3.23 Jul/Sep and Jul/Dec future spreads were 5 and 16 cents.
| Jul 20 | Change | Dec 20 | Change |
Price | $3.19 | $0.01 | $3.35 | -$0.01 |
Support | $3.14 | $0.06 | $3.31 | $0.04 |
Resistance | $3.25 | -$0.03 | $3.40 | -$0.04 |
20 Day MA | $3.21 | -$0.05 | $3.37 | -$0.04 |
50 Day MA | $3.42 | -$0.07 | $3.54 | -$0.05 |
100 Day MA | $3.68 | -$0.04 | $3.75 | -$0.03 |
4-Week High | $3.38 | -$0.08 | $3.52 | -$0.01 |
4-Week Low | $3.09 | $0.00 | $3.25 | $0.00 |
Technical Trend | Down | + | Down | = |
Nationally the Crop Progress report estimated corn planting at 51% compared to 27% last week, 21% last year, and a 5-year average of 39%; and corn emerged was 8% compared to 3% last week, 5% last year, and a 5-year average of 10%. In Tennessee, the Crop Progress report estimated corn planted at 54% compared to 35% last week, 58% last year, and a 5-year average of 63%; and corn emerged at 26% compared to 13% last week, 31% last year, and a 5-year average of 32%. In Tennessee, new crop cash corn contracts ranged from $3.02 to $3.25. September 2020 corn futures closed at $3.24, down 1 cent since last Friday. December 2020 corn futures closed at $3.35, down 1 cent since last Friday. Downside price protection could be obtained by purchasing a $3.40 December 2020 Put Option costing 25 cents establishing a $3.15 futures floor.
Soybeans
Net sales reported by exporters were down compared to last week with net sales of 24 million bushels for the 2019/20 marketing year and 6.5 million bushels for the 2020/21 marketing year. Exports for the same period were down 23% compared to last week at 16.2 million bushels. Soybean export sales and commitments were 82% of the USDA estimated total annual exports for the 2019/20 marketing year (September 1 to August 31), compared to the previous 5-year average of 96%. Average soybean basis weakened or remained unchanged at Memphis, Northwest Barge Points, Northwest, and Upper-middle Tennessee. Basis ranged from 27 under to 28 over the July futures contract at elevators and barge points. Average basis at the end of the week was 10 over the July futures contract. July 2020 soybean futures closed at $8.50, up 1 cent since last Friday. For the week, July 2020 soybean futures traded between $8.31 and $8.56. Jul/Aug and Jul/Nov future spreads were 2 and 5 cents. August 2020 soybean futures closed at $8.52, up 2 cents since last Friday. July soybean-to-corn price ratio was 2.66 at the end of the week.
Soybeans | Jul 20 | Change | Nov 20 | Change |
Price | $8.50 | $0.01 | $8.55 | $0.00 |
Support | $8.25 | -$0.07 | $8.41 | -$0.06 |
Resistance | $8.58 | -$0.09 | $8.66 | $0.04 |
20 Day MA | $8.43 | -$0.06 | $8.50 | -$0.05 |
50 Day MA | $8.62 | -$0.07 | $8.66 | -$0.06 |
100 Day MA | $9.00 | -$0.05 | $9.05 | -$0.05 |
4-Week High | $8.77 | $0.00 | $8.82 | $0.00 |
4-Week Low | $8.18 | $0.00 | $8.31 | $0.00 |
Technical Trend | Down | = | Down | = |
Nationally the Crop Progress report estimated soybean planting at 23% compared to 8% last week, 5% last year, and a 5-year average of 11%. In Tennessee, soybeans planted were estimated at 14% compared to 8% last week, 7% last year, and a 5-year average of 8%. In Tennessee, new crop soybean cash contracts ranged from $8.09 to $8.68. Nov/Dec 2020 soybean-to-corn price ratio was 2.55 at the end of the week. November 2020 soybean futures closed at $8.55, unchanged since last Friday. Downside price protection could be achieved by purchasing an $8.60 November 2020 Put Option which would cost 43 cents and set an $8.17 futures floor.
Cotton
Net sales reported by exporters were down compared to last week with net sales of 370,300 bales for the 2019/20 marketing year and 55,900 bales for the 2020/21 marketing year. Exports for the same time period were up 46% compared to last week at 370,300 bales. Upland cotton export sales were 114% of the USDA estimated total annual exports for the 2019/20 marketing year (August 1 to July 31), compared to the previous 5-year average of 101%. Delta upland cotton spot price quotes for May 7 were 52.39 cents/lb (41-4-34) and 54.64 cents/lb (31-3-35). Adjusted World Price (AWP) decreased 0.98 cents to 46.01 cents. July 2020 cotton futures closed at 56.27 cents, up 0.43 cents since last Friday. For the week, July 2020 cotton futures traded between 53.2 and 57.05 cents. Jul/Dec and Jul/Mar cotton futures spreads were 1.35 cents and 2.17 cents.
Cotton | Jul 20 | Change | Dec 20 | Change |
Price | 56.27 | 0.43 | 57.62 | 0.10 |
Support | 54.58 | 0.51 | 56.39 | 0.54 |
Resistance | 57.90 | -0.45 | 58.81 | -1.04 |
20 Day MA | 54.78 | 0.43 | 56.66 | 0.53 |
50 Day MA | 55.89 | -1.21 | 57.27 | -1.03 |
100 Day MA | 63.11 | -0.66 | 63.61 | -0.57 |
4-Week High | 57.98 | 0.00 | 59.50 | 0.00 |
4-Week Low | 52.01 | 3.76 | 54.30 | 4.12 |
Technical Trend | Down | = | Down | = |
Nationally, the Crop Progress report estimated cotton planted at 18%, compared to 13% last week, 16% last year, and a 5-year average of 17%. In Tennessee, cotton planted was estimated at 4% compared to 2% last week, 9% last year, and a 5-year average of 8%. December 2020 cotton futures closed at 57.56, up 0.1 cents since last Friday. Downside price protection could be obtained by purchasing a 58 cent December 2020 Put Option costing 4.6 cents establishing a 53.4 cent futures floor. March 2021 cotton futures closed at 58.44 cents, down 0.18 cents since last Friday.
Wheat
Wheat net sales reported by exporters were down compared to last week with net sales of 9 million bushels for the 2019/20 marketing year and 5 million bushels for the 2020/21 marketing year. Exports for the same time period were up 30% from last week at 20.9 million bushels. Wheat export sales were 98% of the USDA estimated total annual exports for the 2019/20 marketing year (June 1 to May 31), compared to the previous 5-year average of 104%.
Wheat | Jul 20 | Change | Sep 20 | Change |
Price | $5.22 | $0.06 | $5.25 | $0.05 |
Support | $5.13 | $0.05 | $5.16 | $0.04 |
Resistance | $5.29 | $0.03 | $5.31 | $0.01 |
20 Day MA | $5.31 | -$0.08 | $5.35 | -$0.07 |
50 Day MA | $5.33 | -$0.02 | $5.37 | -$0.02 |
100 Day MA | $5.45 | $0.00 | $5.50 | $0.00 |
4-Week High | $5.64 | $0.00 | $5.68 | $0.00 |
4-Week Low | $5.05 | -$0.01 | $5.10 | -$0.02 |
Technical Trend | Down | = | Down | + |
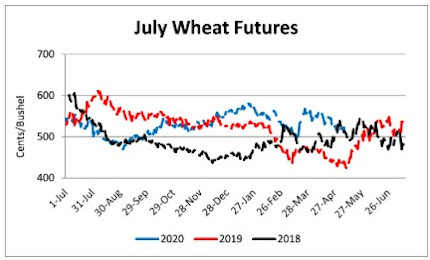
Nationally the Crop Progress report estimated winter wheat condition at 55% good-to-excellent and 14% poor-to-very poor; winter wheat headed at 32% compared to 21% last week, 26% last year, and a 5-year average of 38%; spring wheat planted at 29% compared to 14% last week, 19% last year, and a 5-year average of 43%; and spring wheat emerged at 6% compared to 4% last week, 4% last year, and a 5-year average of 16%. In Tennessee, winter wheat condition was estimated at 61% good-to-excellent and 4% poor-to-very poor; winter wheat jointing at 98% compared to 95% last week, 96% last year, and a 5-year average of 95%; and winter wheat headed at 81% compared to 58% last week, 68% last year, and a 5-year average of 66%. In Tennessee, June/July 2020 cash contracts ranged from $4.98 to $5.45. July 2020 wheat futures closed at $5.22, up 6 cents since last Friday. July 2020 wheat futures traded between $5.05 and $5.27 this week. July wheat-to-corn price ratio was 1.64. Jul/Sept and Jul/Jul future spreads were 3 and 15 cents. September 2020 wheat futures closed at $5.25, up 5 cents since last Friday. September wheat-to-corn price ratio was 1.62. July 2021 wheat futures closed at $5.37, up 8 cents since last Friday. Downside price protection could be obtained by purchasing a $5.30 July 2021 Put Option costing 42 cents establishing a $4.88 futures floor.
Source : tennessee.edu