Results of a variable rate corn population trial in Oxford County conducted during the 2013 season are presented below. In an earlier post we talked about the importance of reviewing as-applied maps. This field had several years of historical yield data which over time can be used to create management zones that are based on productivity. In this case, all corn yield years (1998, 2000, 2002, 2005, 2007, 2010) were normalized (against the mean in a given year) to create a multi-year management zone map. A population prescription map for the field was designed for 3 yield zones: low, medium and high. A higher population was put in zones where the zone consistently produced a high yield over time, and vice versa for the consistently low yielding zones. In summary: low yield zones were prescribed a plant population of 32, 000 seeds per acre, moderately yielding zones were prescribed 36, 000 seeds per acre, and high yielding zones were prescribed 40, 000 seeds per acre. Fixed rate strips were placed down the length of the field to hit all management zones so that yield response analysis could be done between conventional uniform population practices and the variable rate population approach.
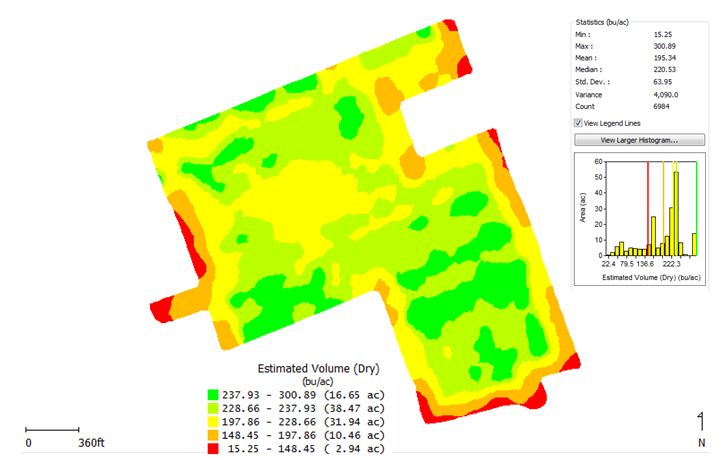
Corn was planted in this field on May 6th and the average population rate across this field was 33.15 ksds/acre as acquired from the as-applied planter report/map. The average yield for this field as determined by the combine report and raw yield data from October 29th and 30th was 219.96 bu/ac. The full yield map and summary statistics shown below.
Uniform passes were analyzed by segmenting the yield map according to the multi-year yield zones defined for this field. The resulting analysis from all three replicates that crossed across all 3 management zones is summarized in the graph below.